 13
13peptides
spectra
0.000 | 0.000
0.000 | 0.000
0.000 | 0.000
0.245 | 0.304
0.210 | 0.275
0.000 | 0.000
0.467 | 0.482
0.000 | 0.009
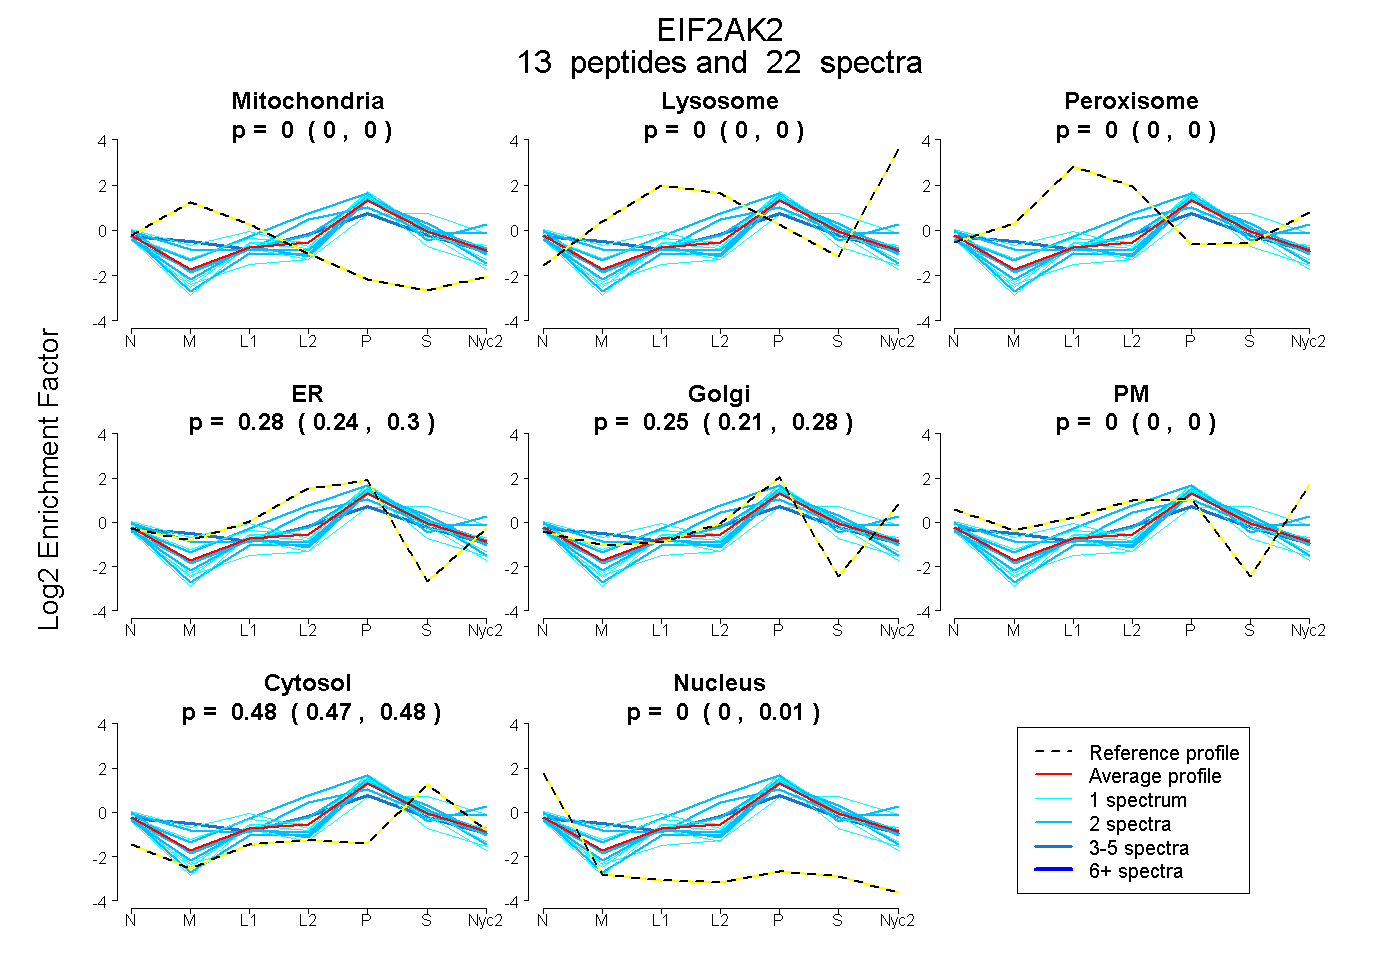
| Plot | Mito | Lyso | Perox | ER | Golgi | PM | Cytosol | Nucleus | |||||
| Expt A |
13 peptides |
22 spectra |
|
0.000 0.000 | 0.000 |
0.000 0.000 | 0.000 |
0.000 0.000 | 0.000 |
0.276 0.245 | 0.304 |
0.247 0.210 | 0.275 |
0.000 0.000 | 0.000 |
0.475 0.467 | 0.482 |
0.002 0.000 | 0.009 |
| 2 spectra, SSLVEYGK | 0.000 | 0.000 | 0.000 | 0.113 | 0.321 | 0.000 | 0.560 | 0.006 | ||
| 2 spectra, LAVEILDNENK | 0.000 | 0.075 | 0.035 | 0.418 | 0.208 | 0.000 | 0.265 | 0.000 | ||
| 2 spectra, TLAEWK | 0.000 | 0.000 | 0.000 | 0.175 | 0.333 | 0.000 | 0.444 | 0.048 | ||
| 4 spectra, EFPEGEGR | 0.115 | 0.000 | 0.000 | 0.371 | 0.109 | 0.000 | 0.404 | 0.000 | ||
| 1 spectrum, TYAIK | 0.000 | 0.000 | 0.006 | 0.304 | 0.304 | 0.000 | 0.386 | 0.000 | ||
| 1 spectrum, EVQALAELNHANIVQYR | 0.000 | 0.000 | 0.000 | 0.472 | 0.002 | 0.000 | 0.472 | 0.053 | ||
| 1 spectrum, IGDFGLATALENDGNPR | 0.000 | 0.000 | 0.000 | 0.032 | 0.447 | 0.000 | 0.470 | 0.051 | ||
| 2 spectra, IEFFQLLR | 0.000 | 0.000 | 0.000 | 0.160 | 0.260 | 0.000 | 0.513 | 0.067 | ||
| 1 spectrum, ITYNTK | 0.000 | 0.000 | 0.000 | 0.262 | 0.210 | 0.000 | 0.507 | 0.021 | ||
| 1 spectrum, YTLDDR | 0.133 | 0.000 | 0.000 | 0.429 | 0.123 | 0.000 | 0.280 | 0.036 | ||
| 1 spectrum, DFEDIEEIGSGGFGQVFK | 0.000 | 0.000 | 0.000 | 0.000 | 0.345 | 0.000 | 0.655 | 0.000 | ||
| 2 spectra, ENLPVNFELCDPDSQLPHR | 0.000 | 0.000 | 0.000 | 0.365 | 0.025 | 0.207 | 0.403 | 0.000 | ||
| 2 spectra, GTLQQWLEK | 0.000 | 0.000 | 0.000 | 0.337 | 0.188 | 0.000 | 0.474 | 0.000 |
| Plot | Mito | Lyso or Perox | ER | Golgi | PM | Cytosol | Nucleus | ||||||
| Expt B |
3 peptides |
4 spectra |
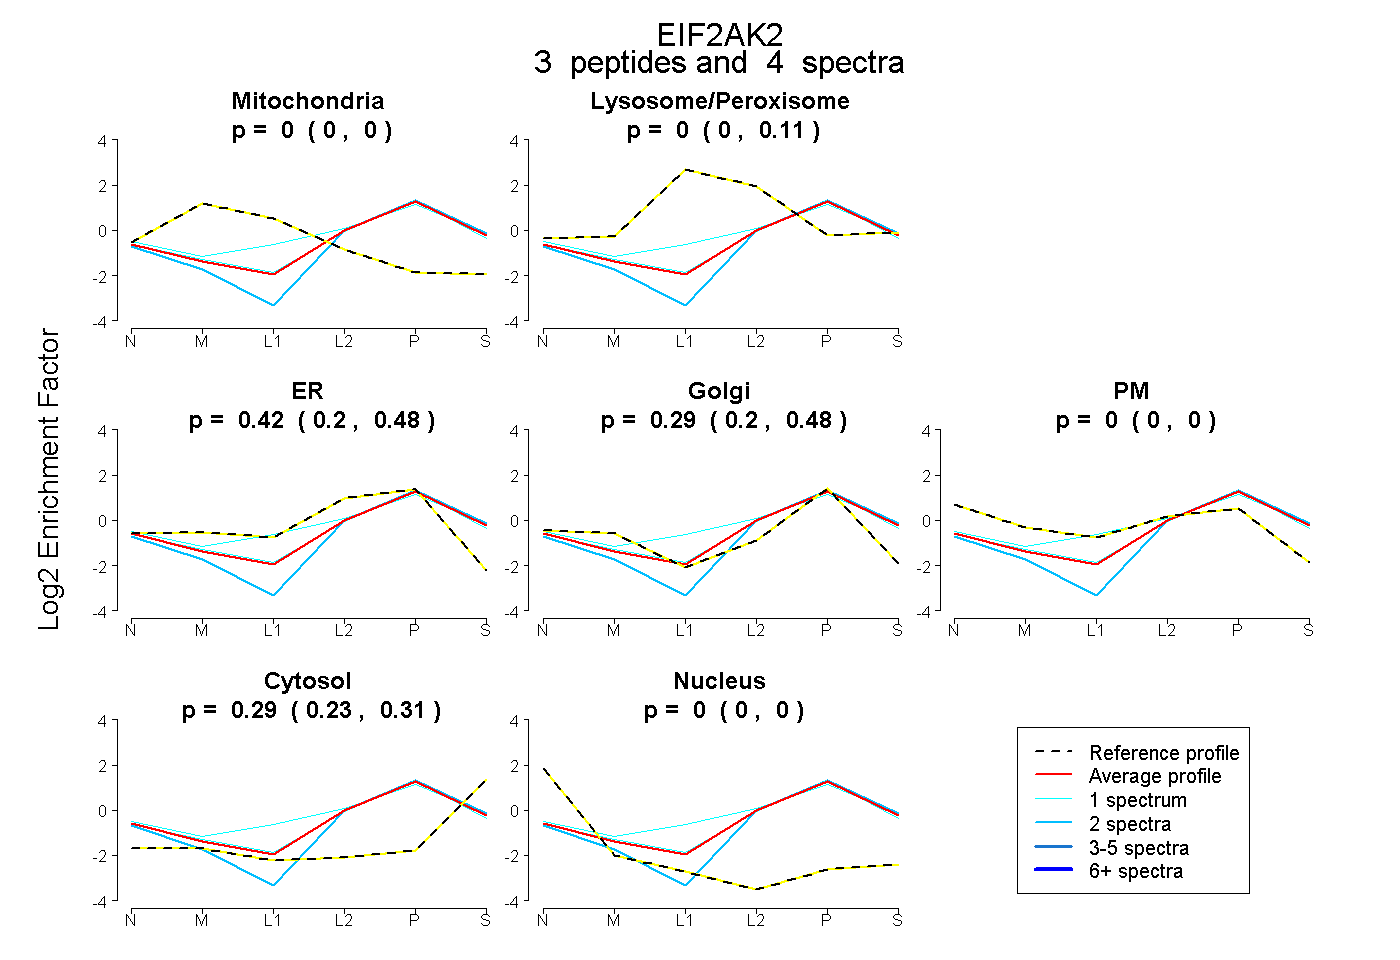 |
0.000 0.000 | 0.000 |
0.000 0.000 | 0.108 |
0.419 0.199 | 0.482 |
0.288 0.201 | 0.480 |
0.000 0.000 | 0.000 |
0.293 0.235 | 0.306 |
0.000 0.000 | 0.000 |
|||
| Plot | Lyso | Other | |||||||||||
| Expt C |
11 peptides |
24 spectra |
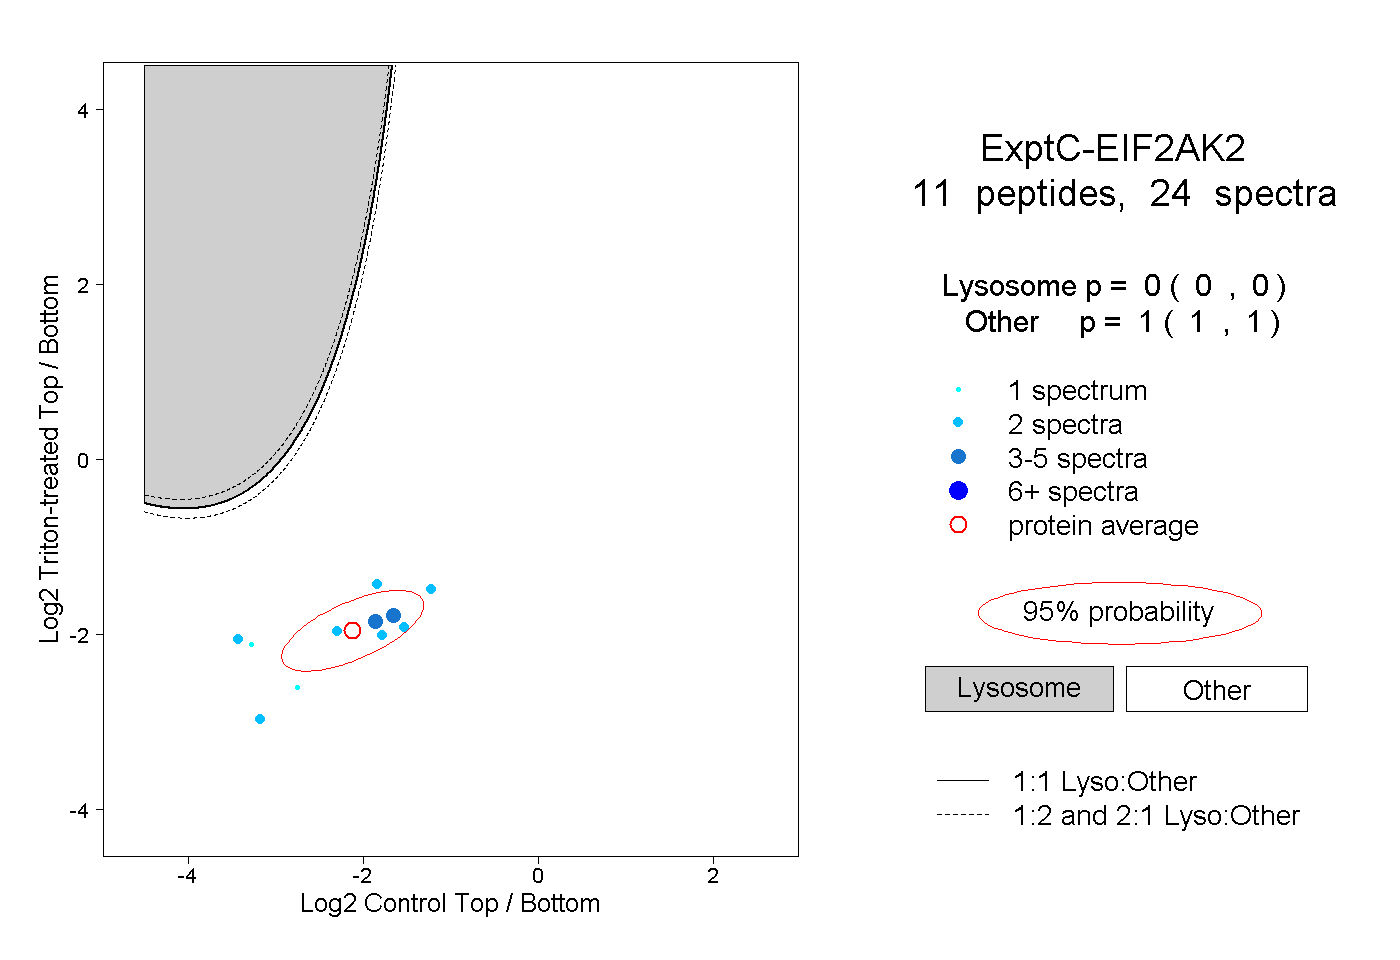 |
0.000 0.000 | 0.000 |
1.000 1.000 | 1.000 |
||||||||
| Plot | Lyso | Other | |||||||||||
| Expt D |
2 peptides |
4 spectra |
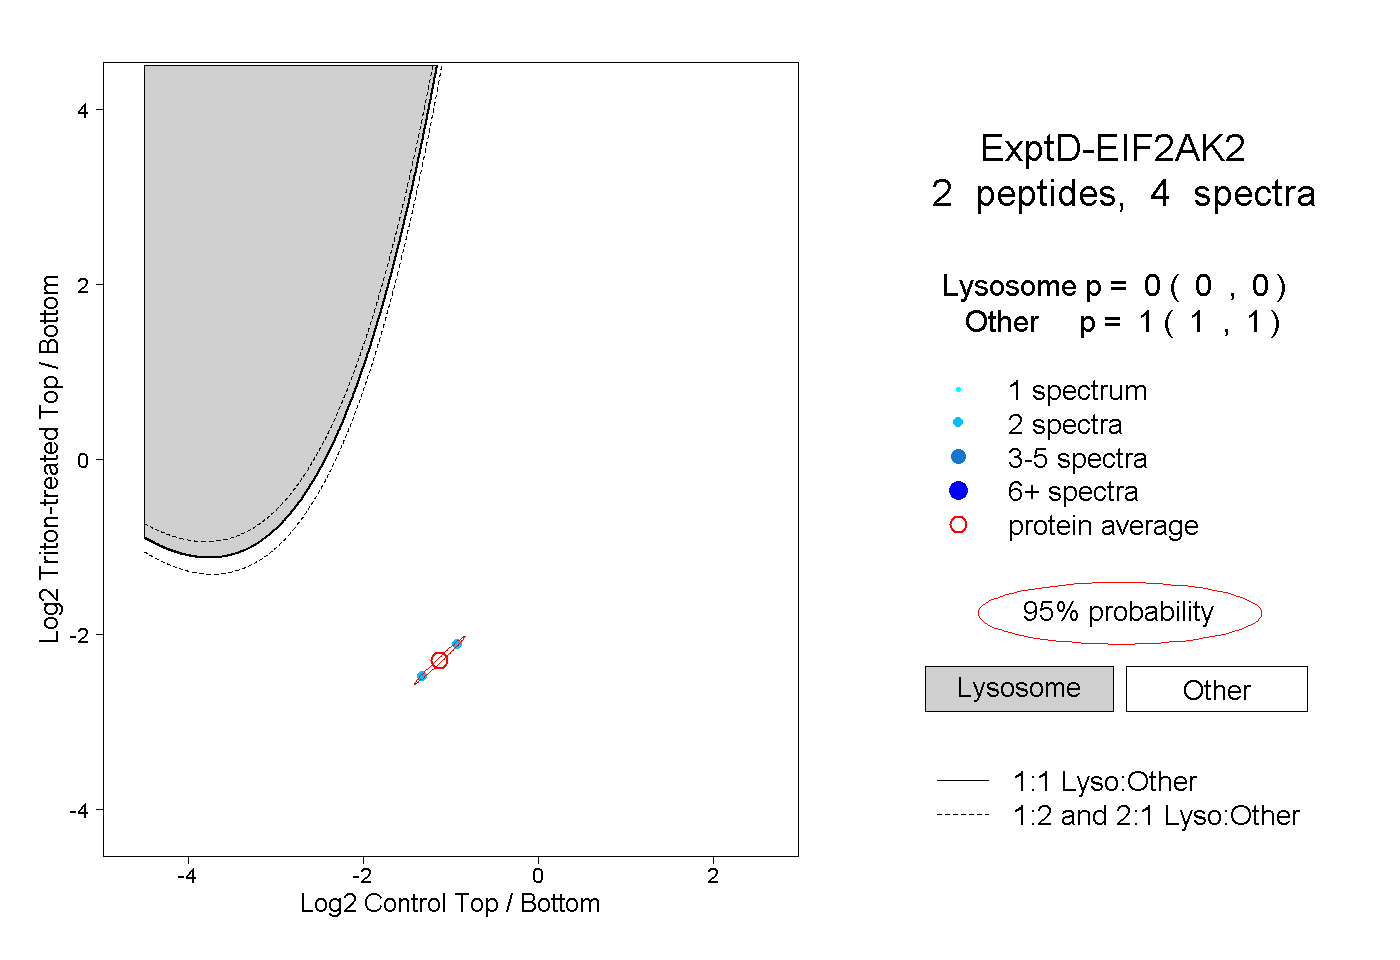 |
0.000 0.000 | 0.000 |
1.000 1.000 | 1.000 |