 5
5peptides
spectra
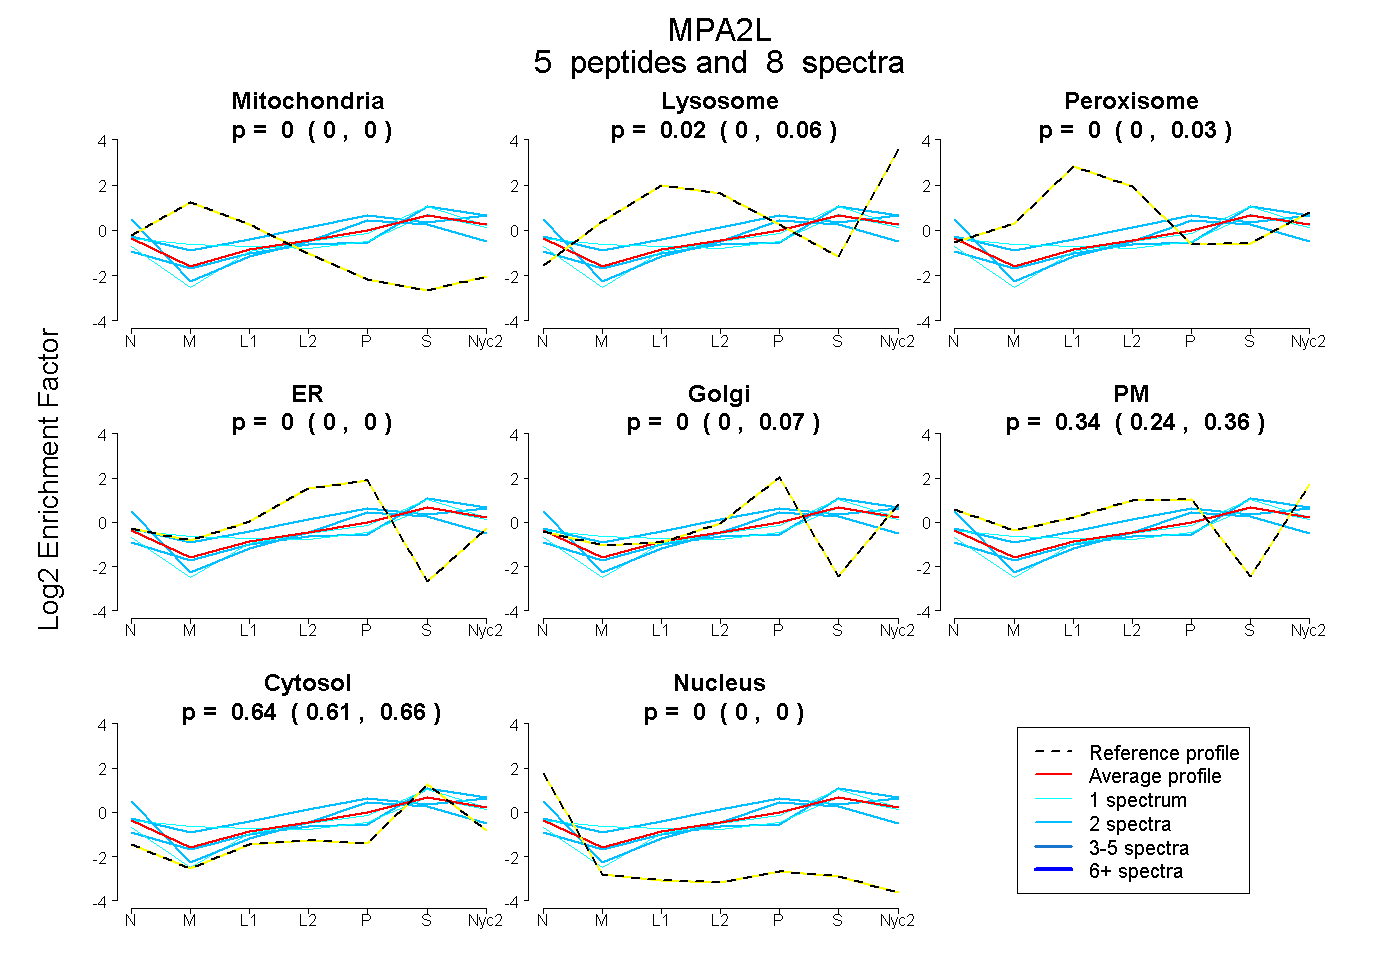
0.000 | 0.000
0.000 | 0.056
0.000 | 0.034
0.000 | 0.000
0.000 | 0.070
0.235 | 0.363
0.613 | 0.659
0.000 | 0.000
2peptides
spectra
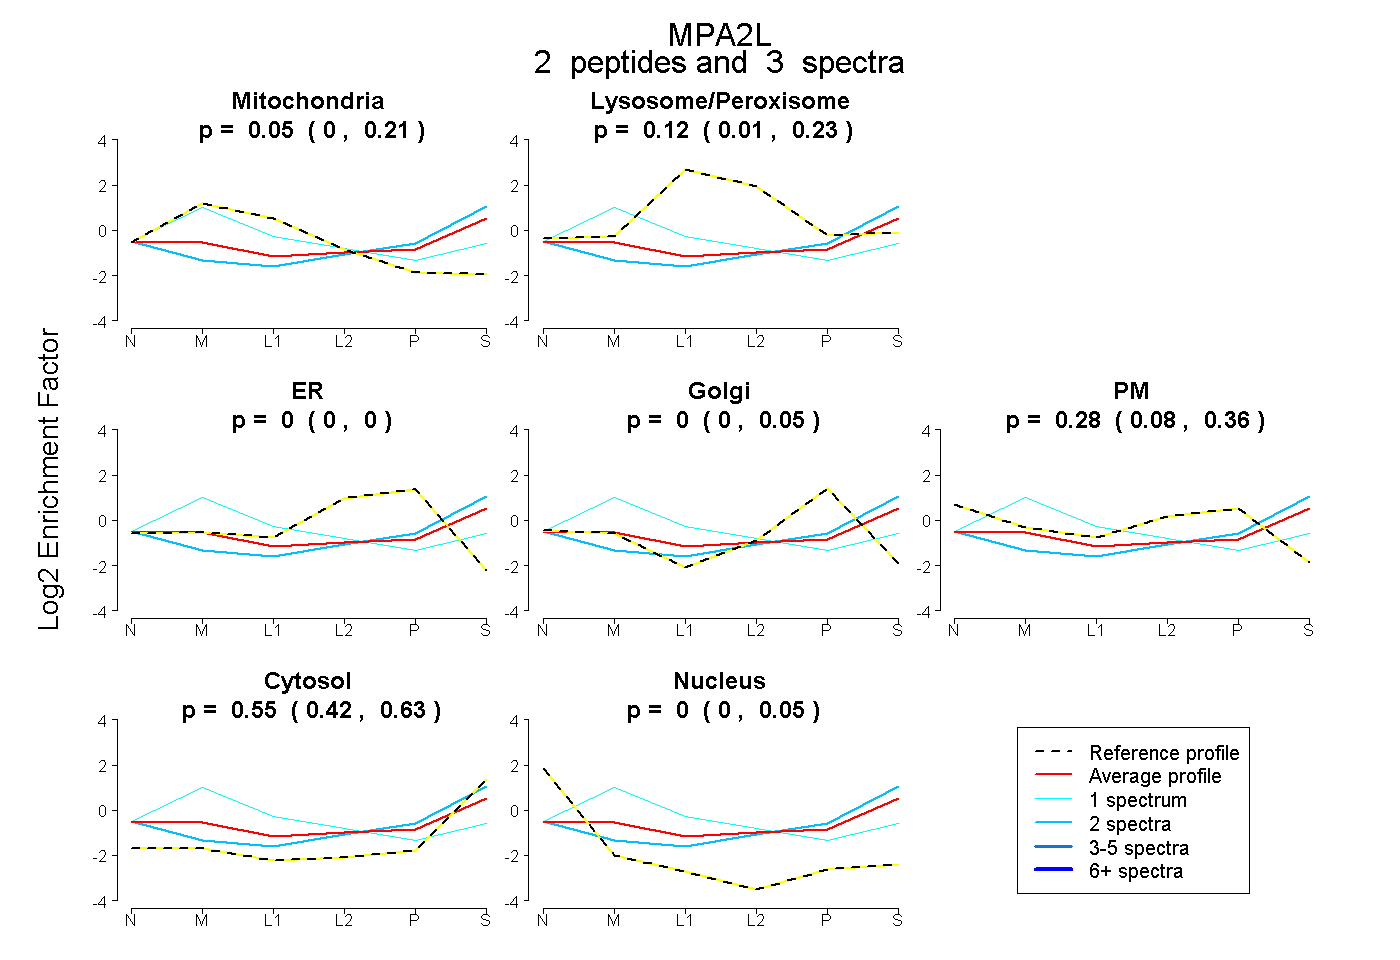
0.000 | 0.212
0.007 | 0.225
0.000 | 0.000
0.000 | 0.046
0.080 | 0.365
0.419 | 0.626
0.000 | 0.053
7peptides
spectra
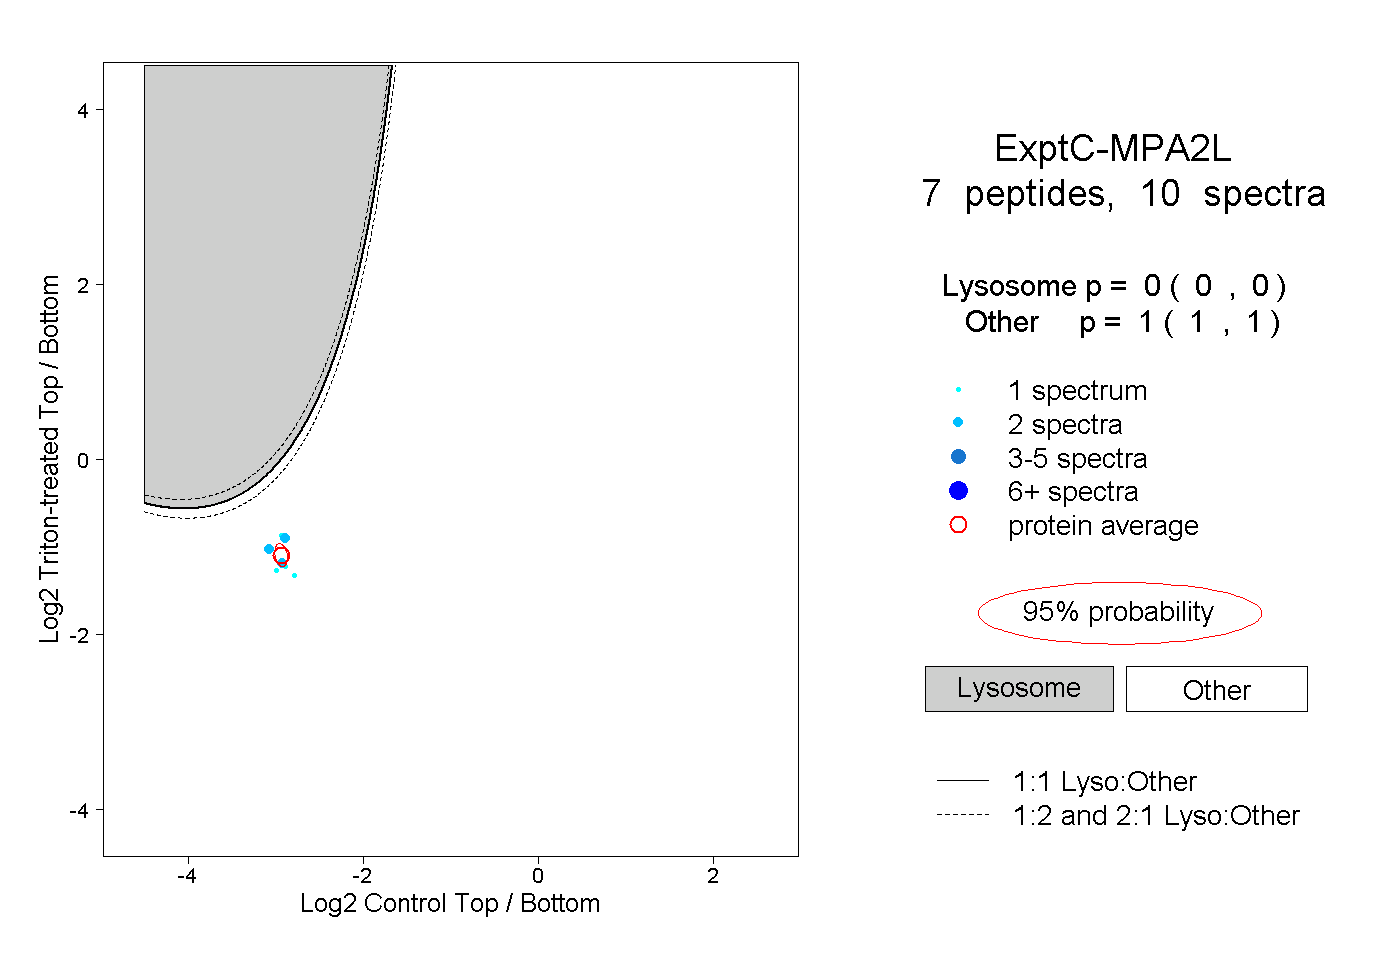
0.000 | 0.000
1.000 | 1.000