 5
5peptides
spectra
0.000 | 0.000
0.000 | 0.056
0.000 | 0.034
0.000 | 0.000
0.000 | 0.070
0.235 | 0.363
0.613 | 0.659
0.000 | 0.000
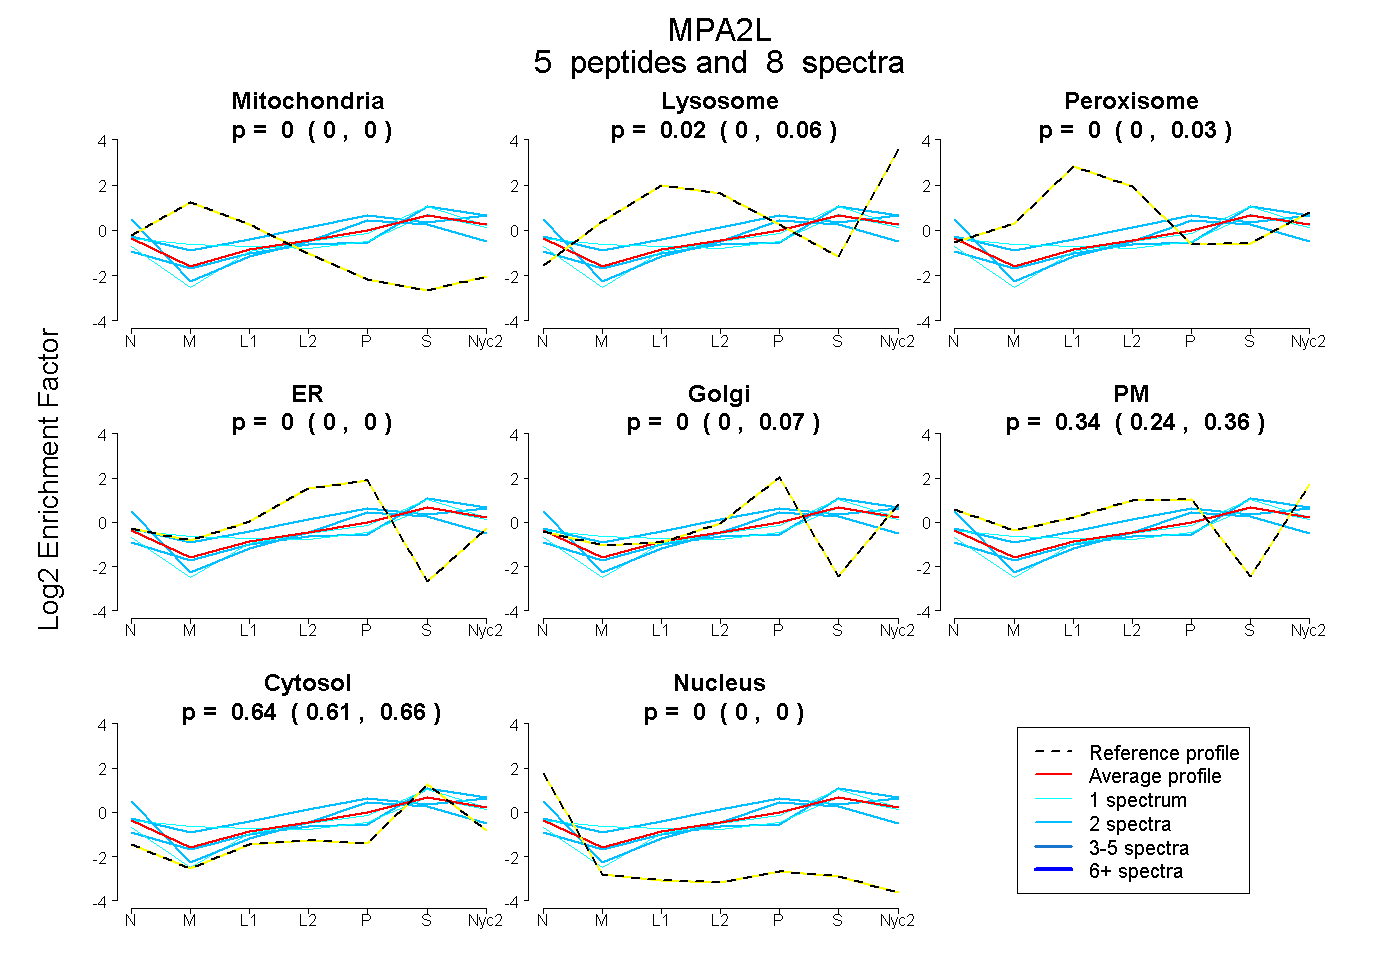
| Plot | Mito | Lyso | Perox | ER | Golgi | PM | Cytosol | Nucleus | |||||
| Expt A |
5 peptides |
8 spectra |
|
0.000 0.000 | 0.000 |
0.018 0.000 | 0.056 |
0.000 0.000 | 0.034 |
0.000 0.000 | 0.000 |
0.000 0.000 | 0.070 |
0.340 0.235 | 0.363 |
0.642 0.613 | 0.659 |
0.000 0.000 | 0.000 |
| 2 spectra, EQQQLMEAQEK | 0.000 | 0.081 | 0.107 | 0.000 | 0.166 | 0.229 | 0.417 | 0.000 | ||
| 1 spectrum, LIPGNSPR | 0.000 | 0.059 | 0.000 | 0.000 | 0.068 | 0.135 | 0.737 | 0.000 | ||
| 2 spectra, QFFPNR | 0.000 | 0.000 | 0.000 | 0.113 | 0.135 | 0.146 | 0.542 | 0.065 | ||
| 2 spectra, AIEILDK | 0.000 | 0.188 | 0.000 | 0.000 | 0.000 | 0.084 | 0.728 | 0.000 | ||
| 1 spectrum, LSVNQK | 0.078 | 0.076 | 0.038 | 0.000 | 0.000 | 0.212 | 0.596 | 0.000 |
| Plot | Mito | Lyso or Perox | ER | Golgi | PM | Cytosol | Nucleus | ||||||
| Expt B |
2 peptides |
3 spectra |
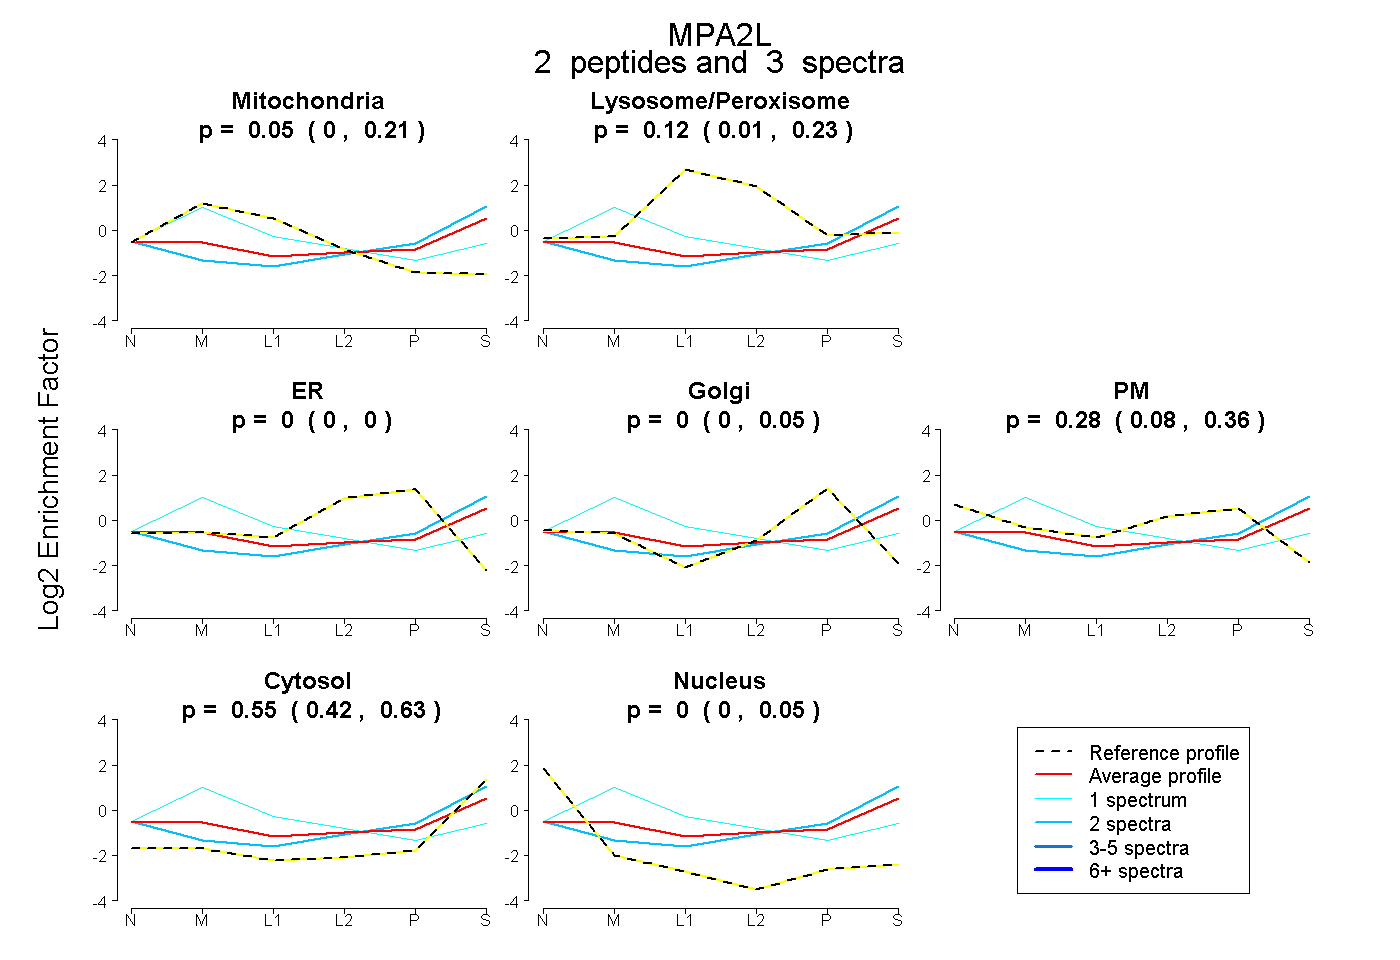 |
0.050 0.000 | 0.212 |
0.119 0.007 | 0.225 |
0.000 0.000 | 0.000 |
0.000 0.000 | 0.046 |
0.283 0.080 | 0.365 |
0.548 0.419 | 0.626 |
0.000 0.000 | 0.053 |
|||
| Plot | Lyso | Other | |||||||||||
| Expt C |
7 peptides |
10 spectra |
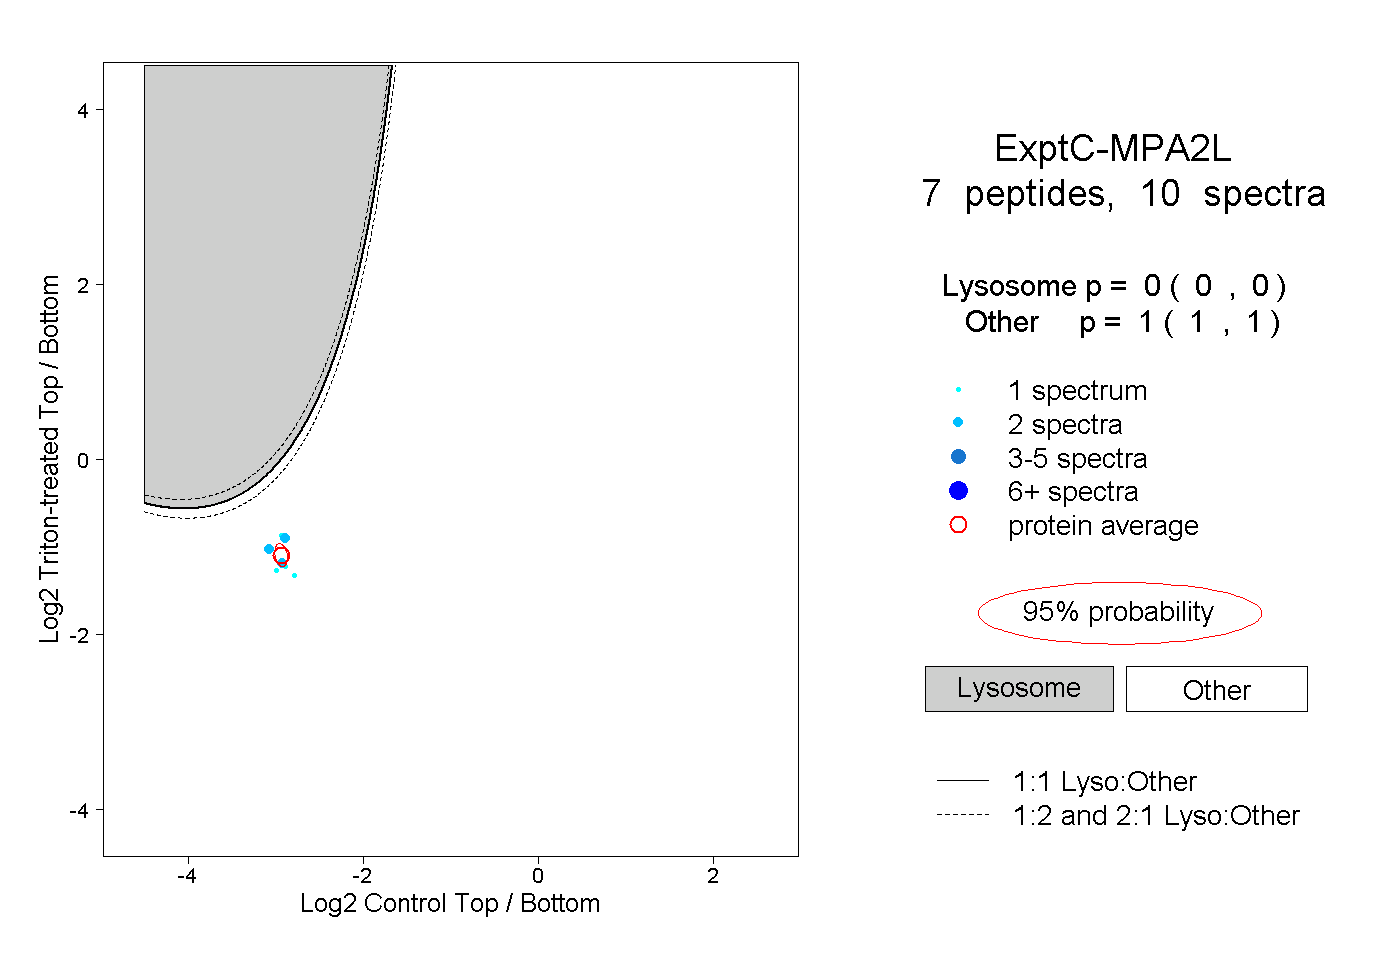 |
0.000 0.000 | 0.000 |
1.000 1.000 | 1.000 |