 6
6peptides
spectra
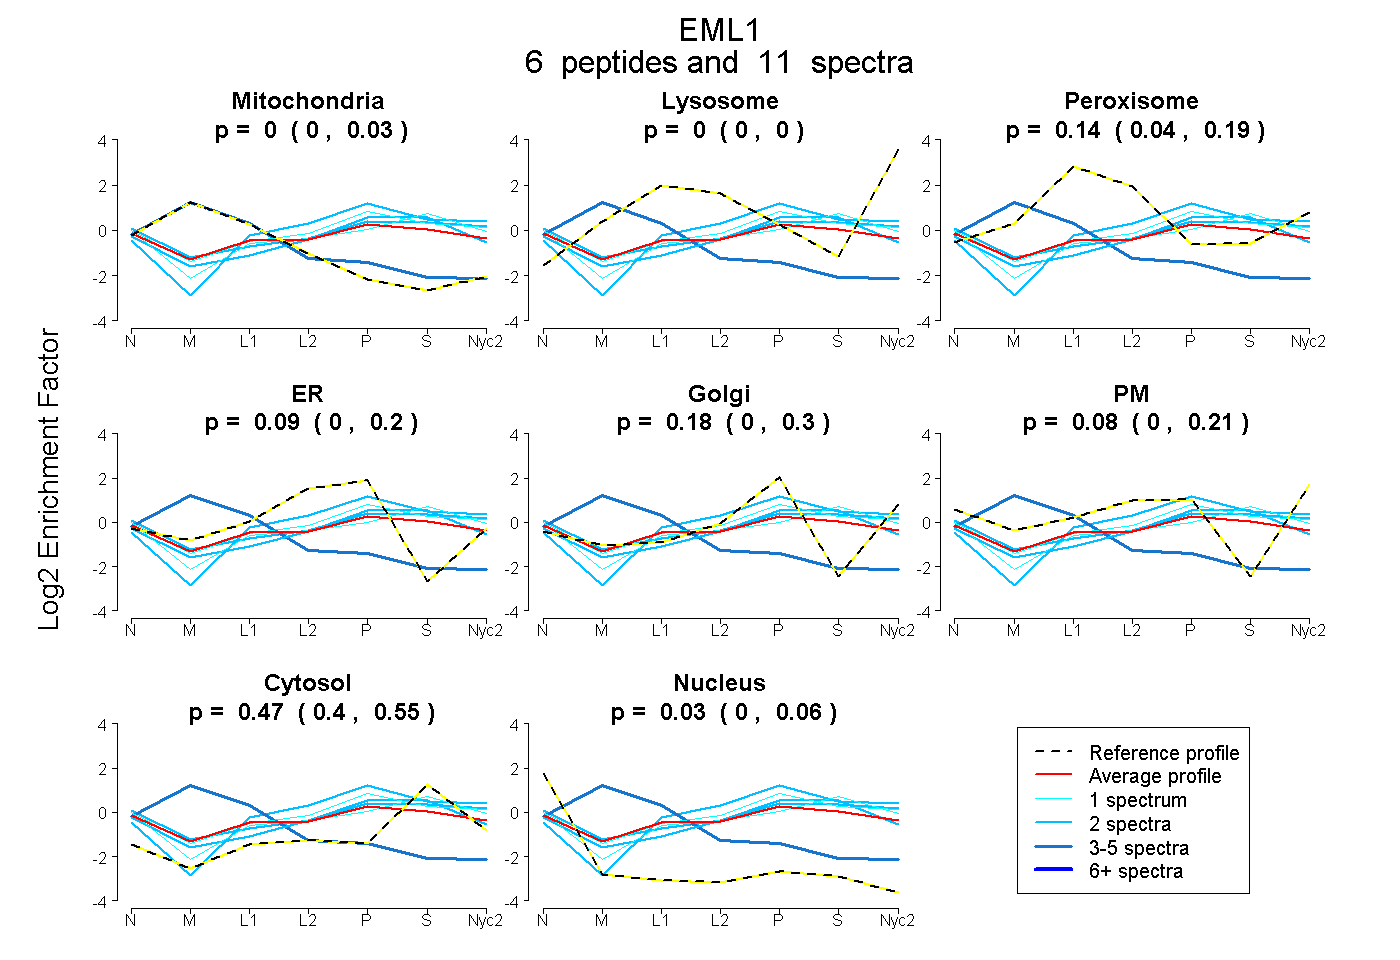
0.000 | 0.030
0.000 | 0.000
0.042 | 0.193
0.000 | 0.201
0.000 | 0.300
0.000 | 0.213
0.402 | 0.546
0.000 | 0.059
1peptide
spectra
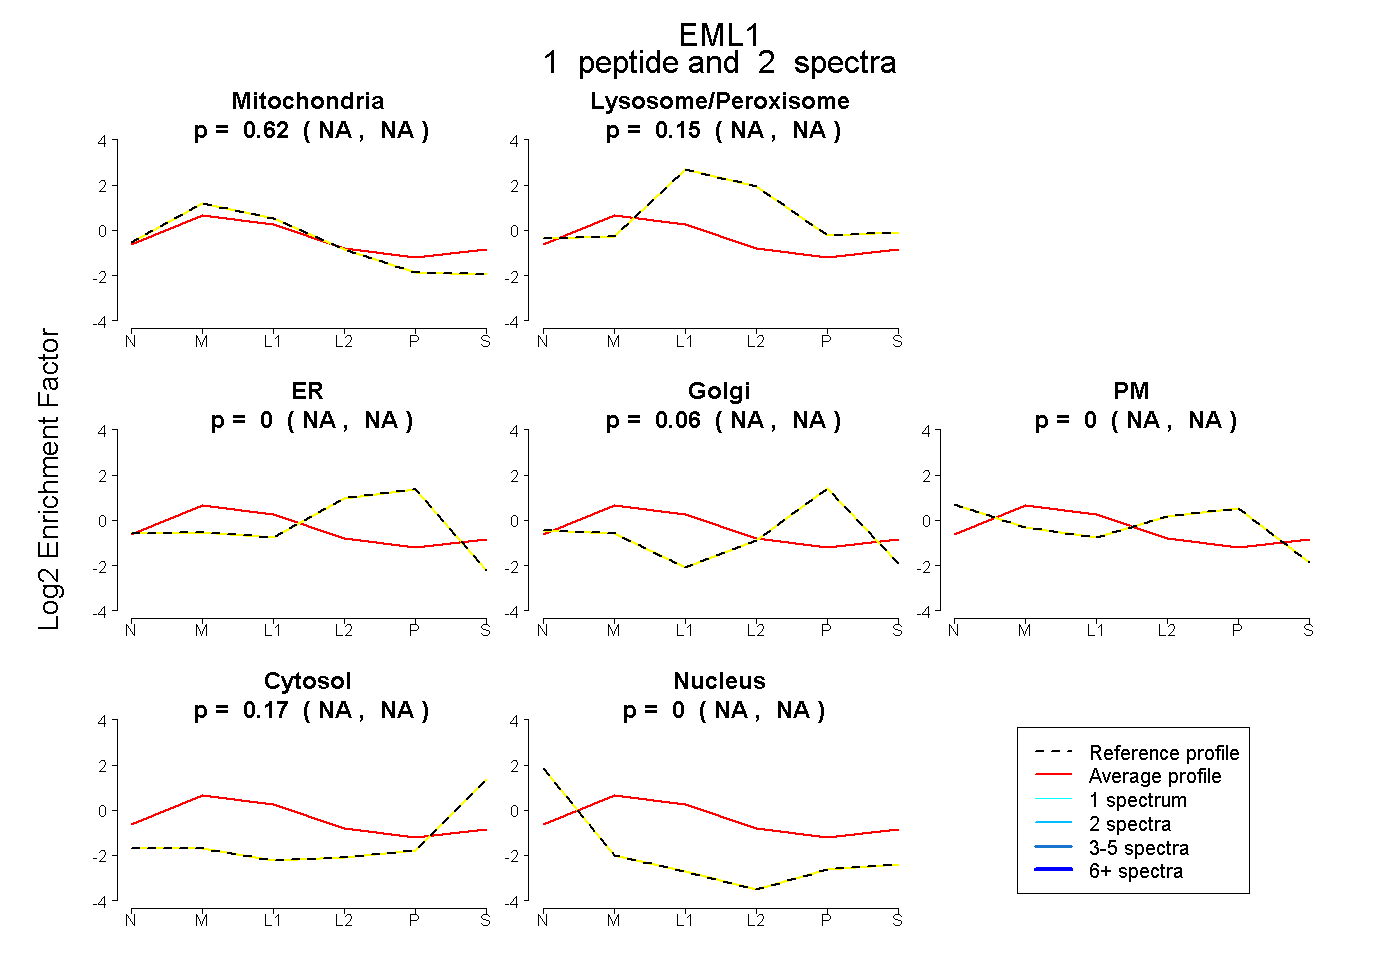
NA | NA
NA | NA
NA | NA
NA | NA
NA | NA
NA | NA
NA | NA
6peptides
spectra
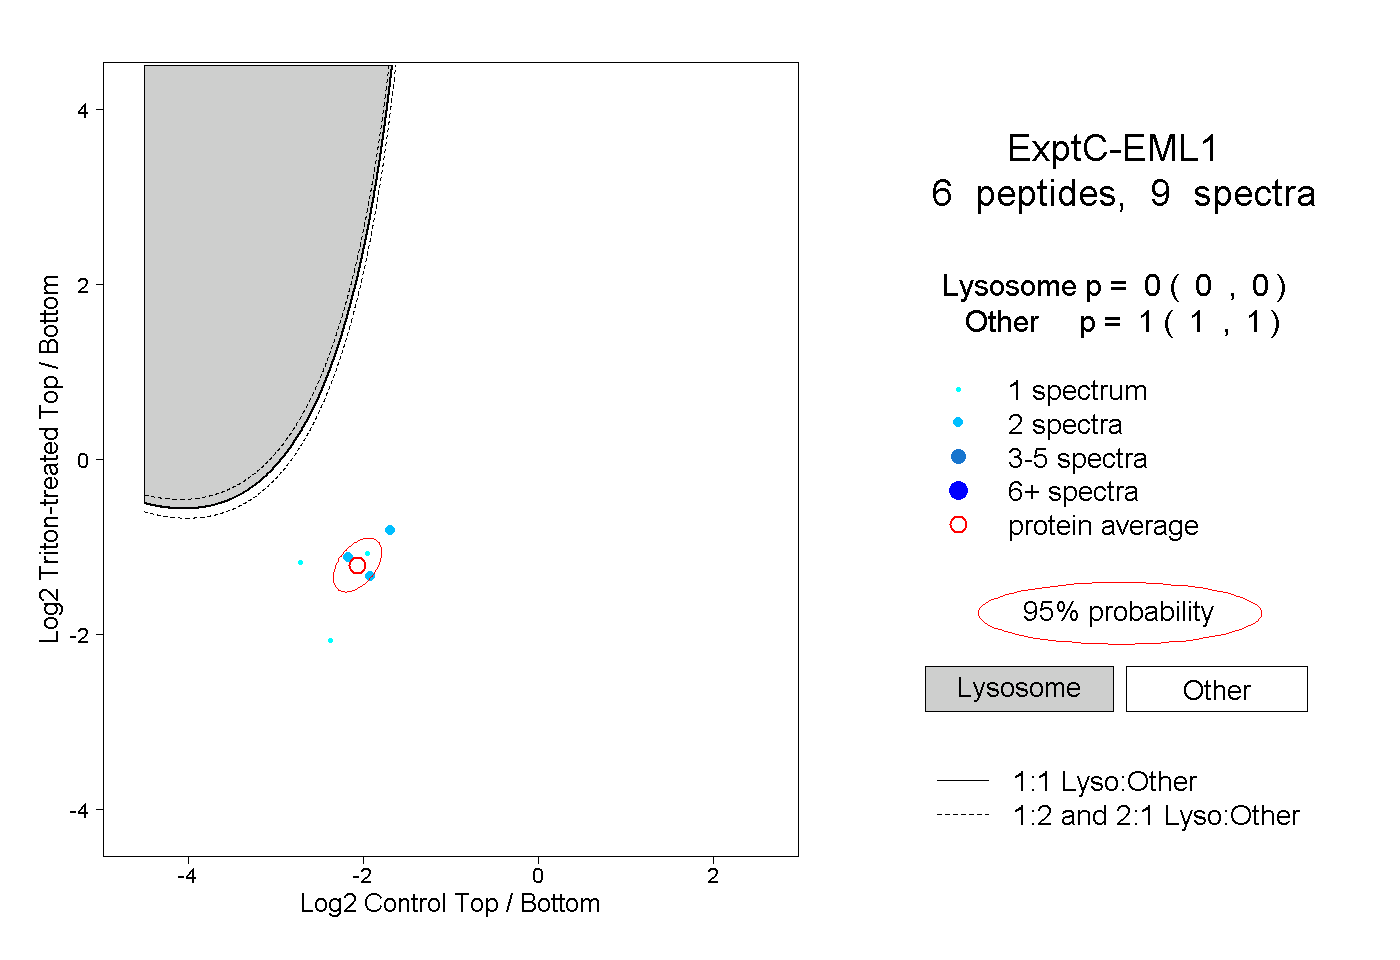
0.000 | 0.000
1.000 | 1.000
1peptide
spectra
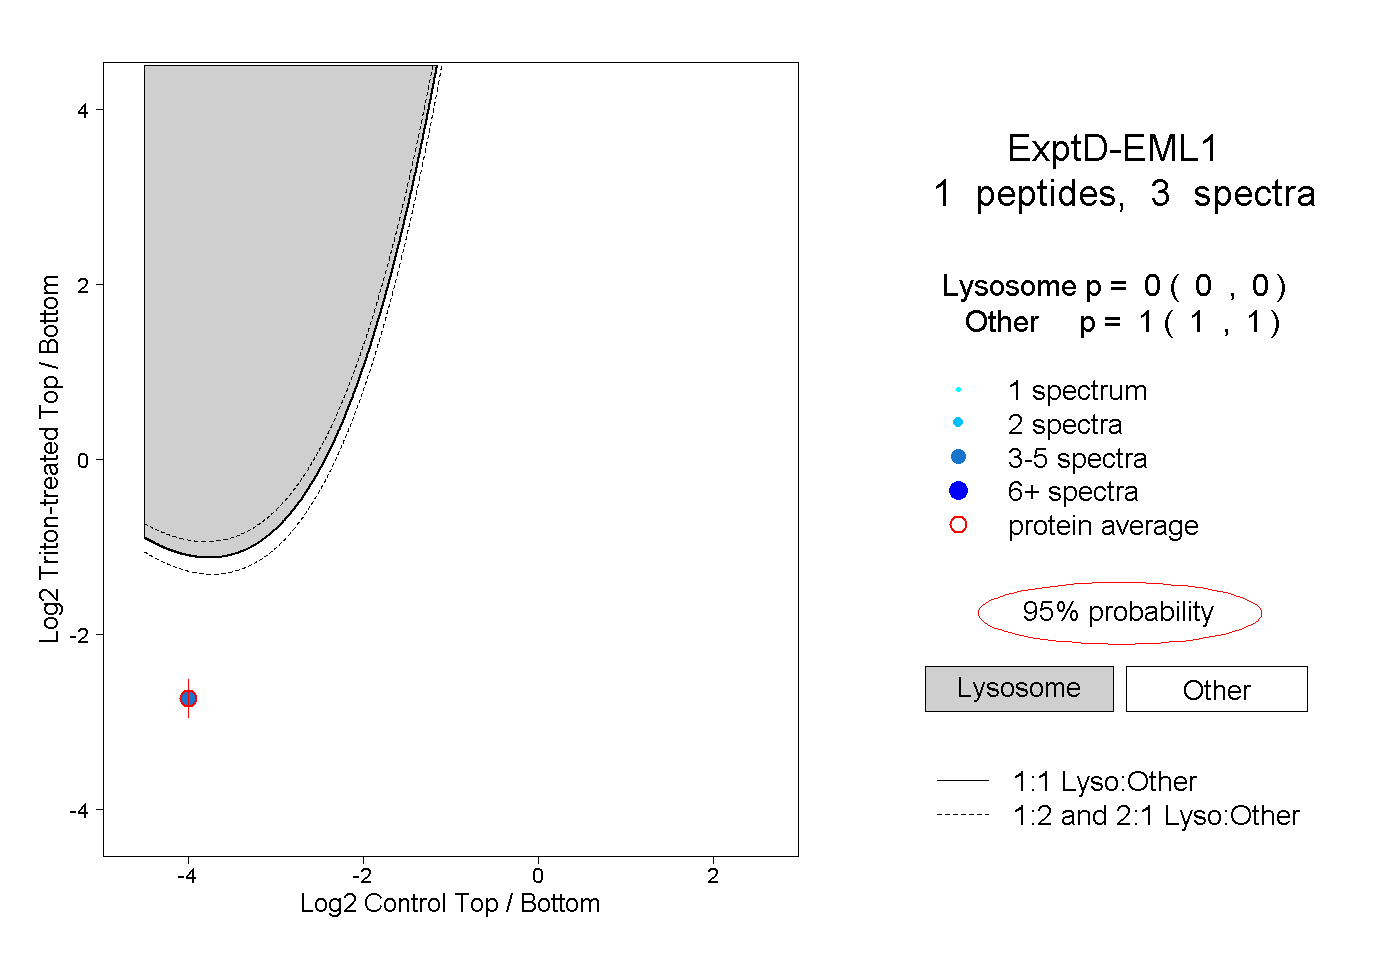
0.000 | 0.000
1.000 | 1.000