 9
9peptides
spectra
0.000 | 0.000
0.000 | 0.054
0.038 | 0.108
0.000 | 0.000
0.000 | 0.051
0.682 | 0.769
0.134 | 0.174
0.000 | 0.000
7peptides
spectra
0.000 | 0.000
1.000 | 1.000
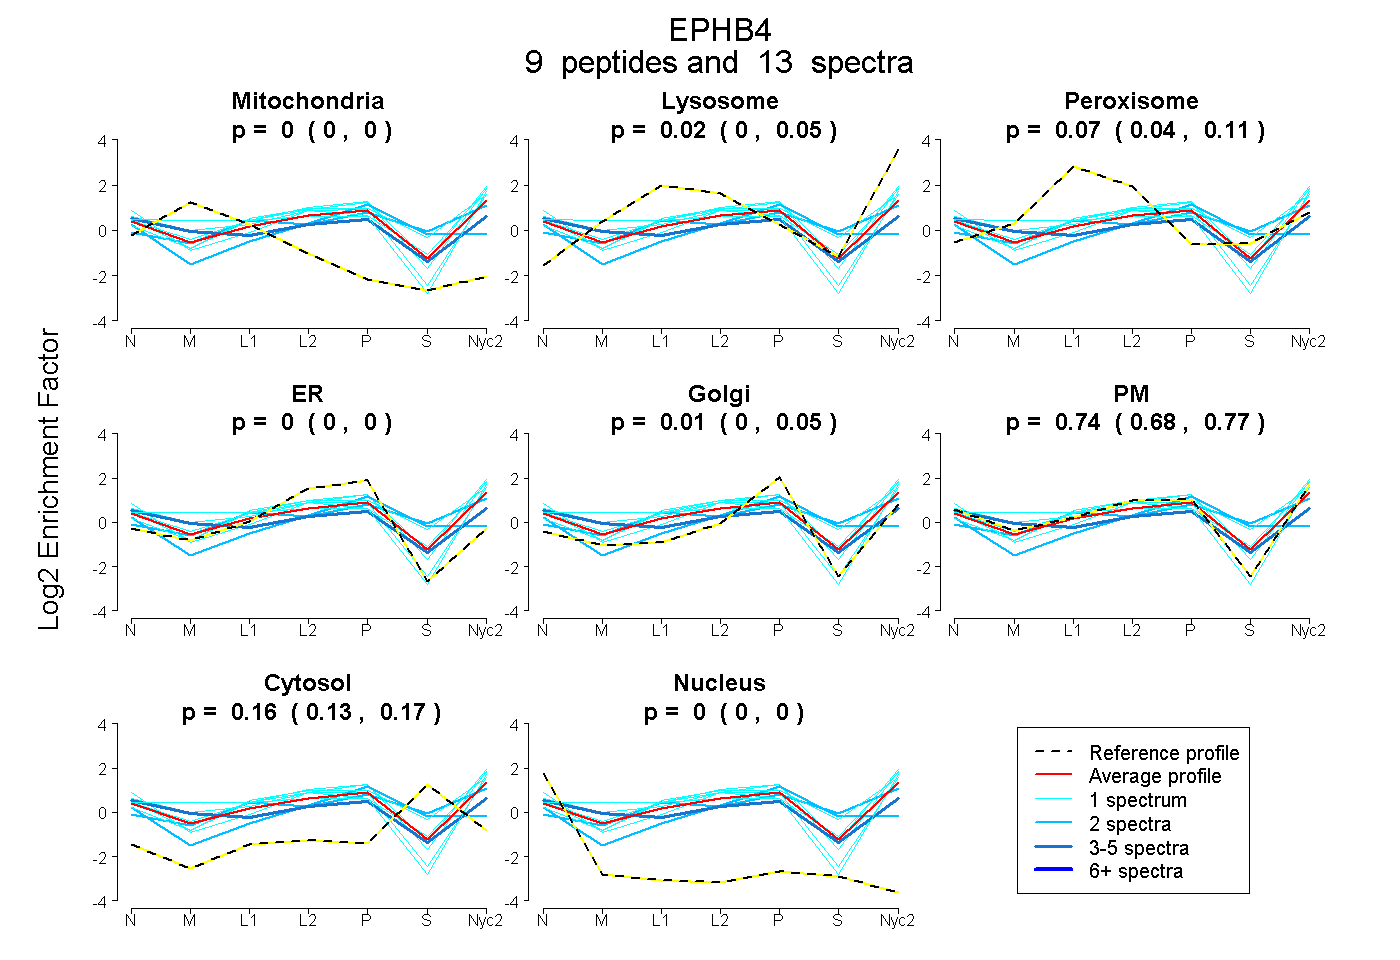
| Plot | Mito | Lyso | Perox | ER | Golgi | PM | Cytosol | Nucleus | |||||
| Expt A |
9 peptides |
13 spectra |
|
0.000 0.000 | 0.000 |
0.021 0.000 | 0.054 |
0.073 0.038 | 0.108 |
0.000 0.000 | 0.000 |
0.007 0.000 | 0.051 |
0.742 0.682 | 0.769 |
0.158 0.134 | 0.174 |
0.000 0.000 | 0.000 |
||
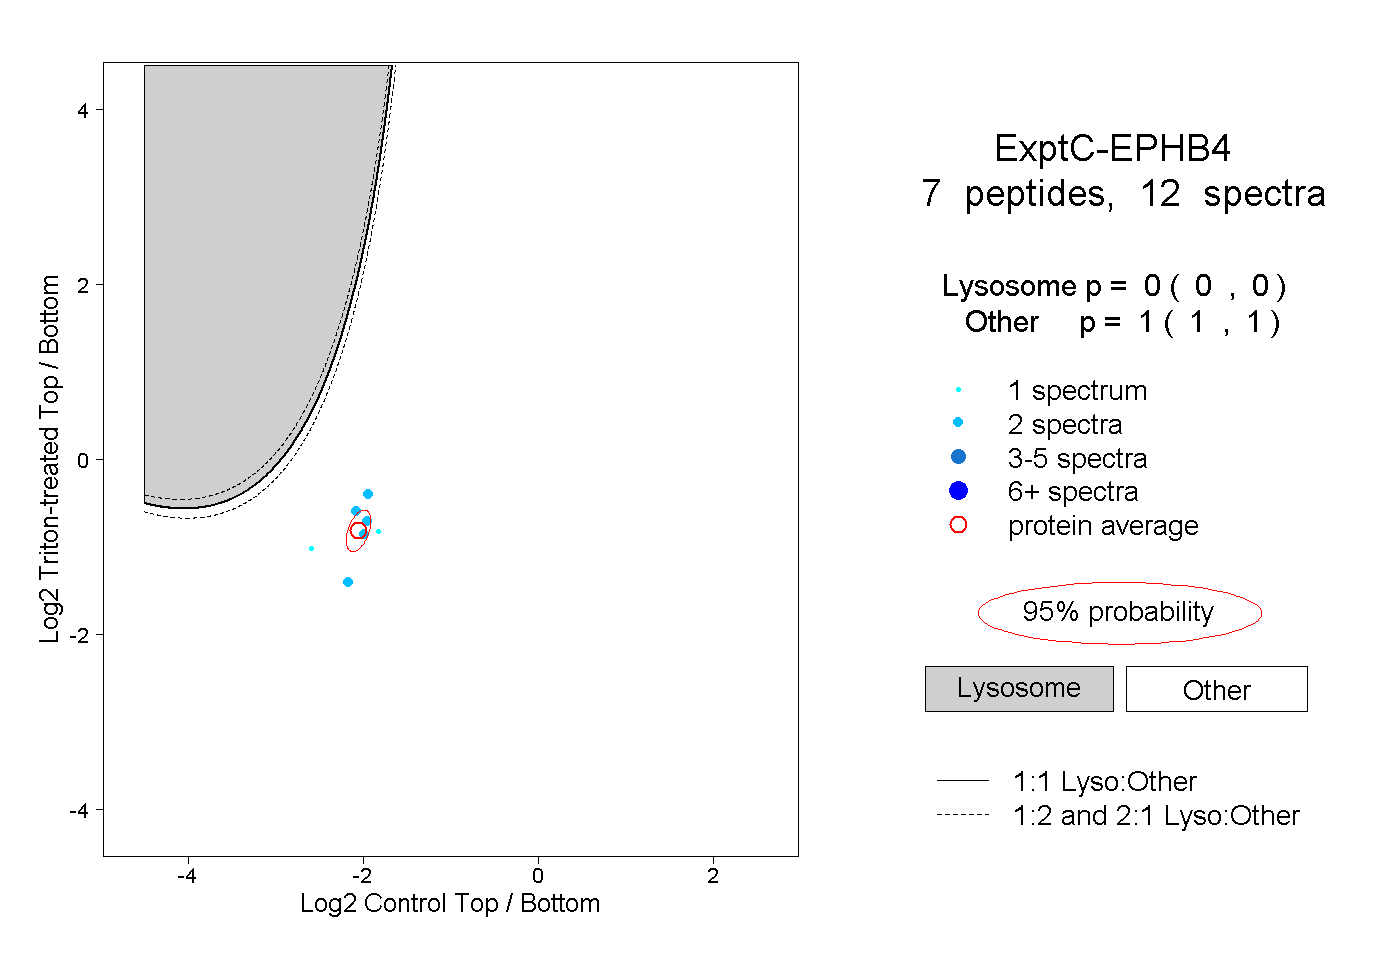
| Plot | Lyso | Other | |||||||||||
| Expt C |
7 peptides |
12 spectra |
|
0.000 0.000 | 0.000 |
1.000 1.000 | 1.000 |