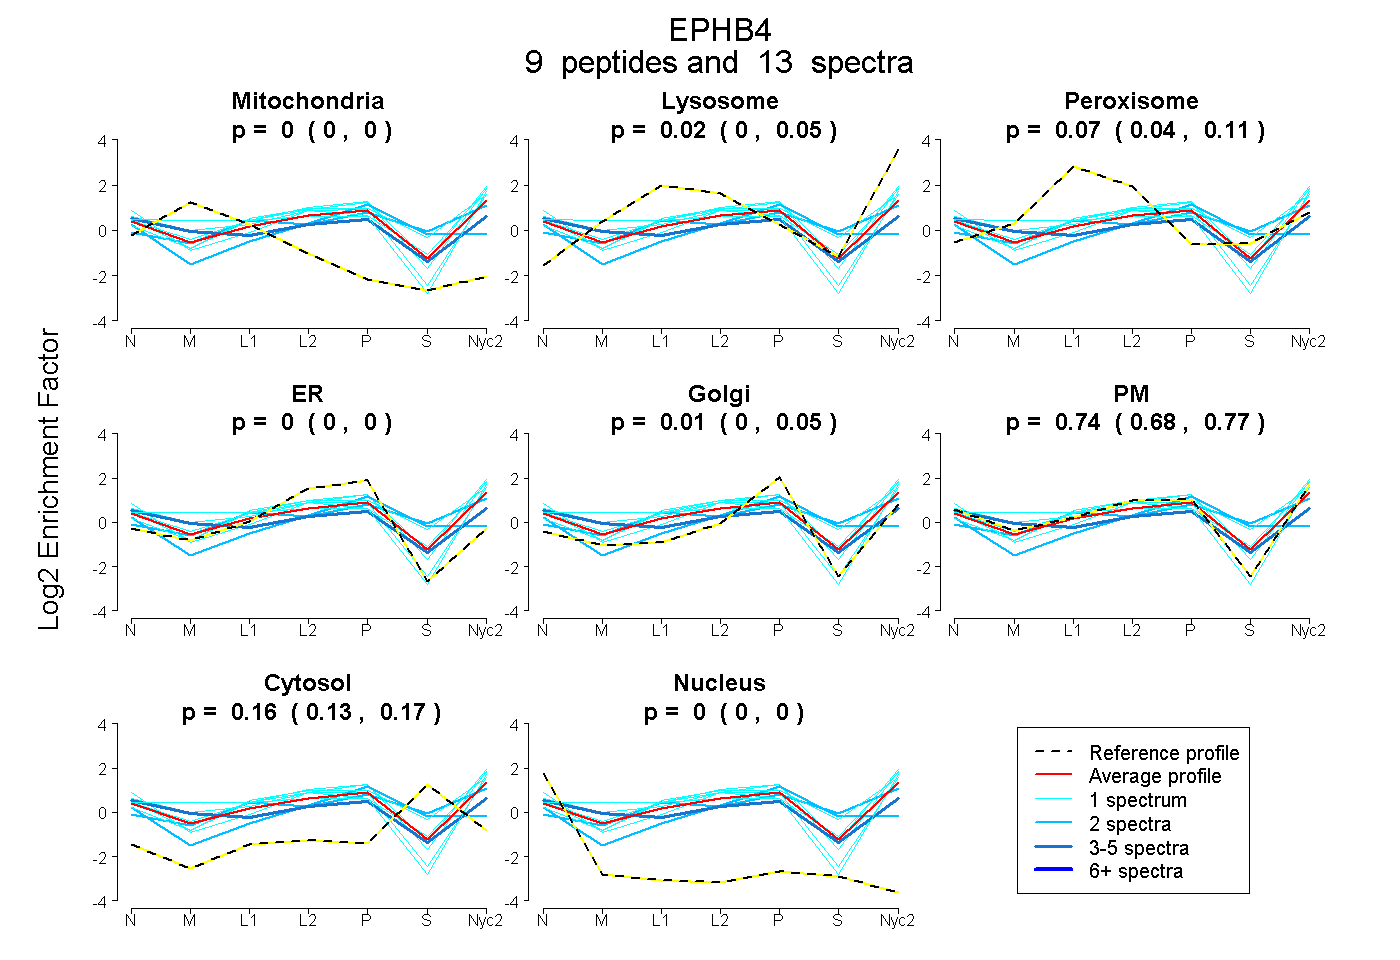
 9
9peptides
spectra
0.000 | 0.000
0.000 | 0.054
0.038 | 0.108
0.000 | 0.000
0.000 | 0.051
0.682 | 0.769
0.134 | 0.174
0.000 | 0.000
| Plot | Mito | Lyso | Perox | ER | Golgi | PM | Cytosol | Nucleus | |||||
| Expt A |
9 peptides |
13 spectra |
|
0.000 0.000 | 0.000 |
0.021 0.000 | 0.054 |
0.073 0.038 | 0.108 |
0.000 0.000 | 0.000 |
0.007 0.000 | 0.051 |
0.742 0.682 | 0.769 |
0.158 0.134 | 0.174 |
0.000 0.000 | 0.000 |
| 1 spectrum, ECRPGGSCLPCGGDLTFDPGPR | 0.000 | 0.041 | 0.000 | 0.000 | 0.000 | 0.792 | 0.167 | 0.000 | ||
| 2 spectra, APSGAVLDYEVK | 0.000 | 0.125 | 0.205 | 0.000 | 0.156 | 0.249 | 0.266 | 0.000 | ||
| 1 spectrum, WTAPEAIAFR | 0.120 | 0.094 | 0.000 | 0.000 | 0.000 | 0.787 | 0.000 | 0.000 | ||
| 1 spectrum, IEEVIGAGEFGEVCR | 0.052 | 0.020 | 0.000 | 0.000 | 0.000 | 0.928 | 0.000 | 0.000 | ||
| 2 spectra, NILVNSNLVCK | 0.000 | 0.000 | 0.000 | 0.374 | 0.016 | 0.208 | 0.401 | 0.000 | ||
| 3 spectra, RPGGQAHWLR | 0.136 | 0.000 | 0.000 | 0.000 | 0.000 | 0.696 | 0.168 | 0.000 | ||
| 1 spectrum, VSDFGLSR | 0.000 | 0.170 | 0.116 | 0.000 | 0.000 | 0.510 | 0.204 | 0.000 | ||
| 1 spectrum, EVEYSDK | 0.000 | 0.136 | 0.000 | 0.000 | 0.000 | 0.780 | 0.084 | 0.000 | ||
| 1 spectrum, FPQVVSALDK | 0.000 | 0.119 | 0.017 | 0.000 | 0.045 | 0.785 | 0.036 | 0.000 |
| Plot | Lyso | Other | |||||||||||
| Expt C |
7 peptides |
12 spectra |
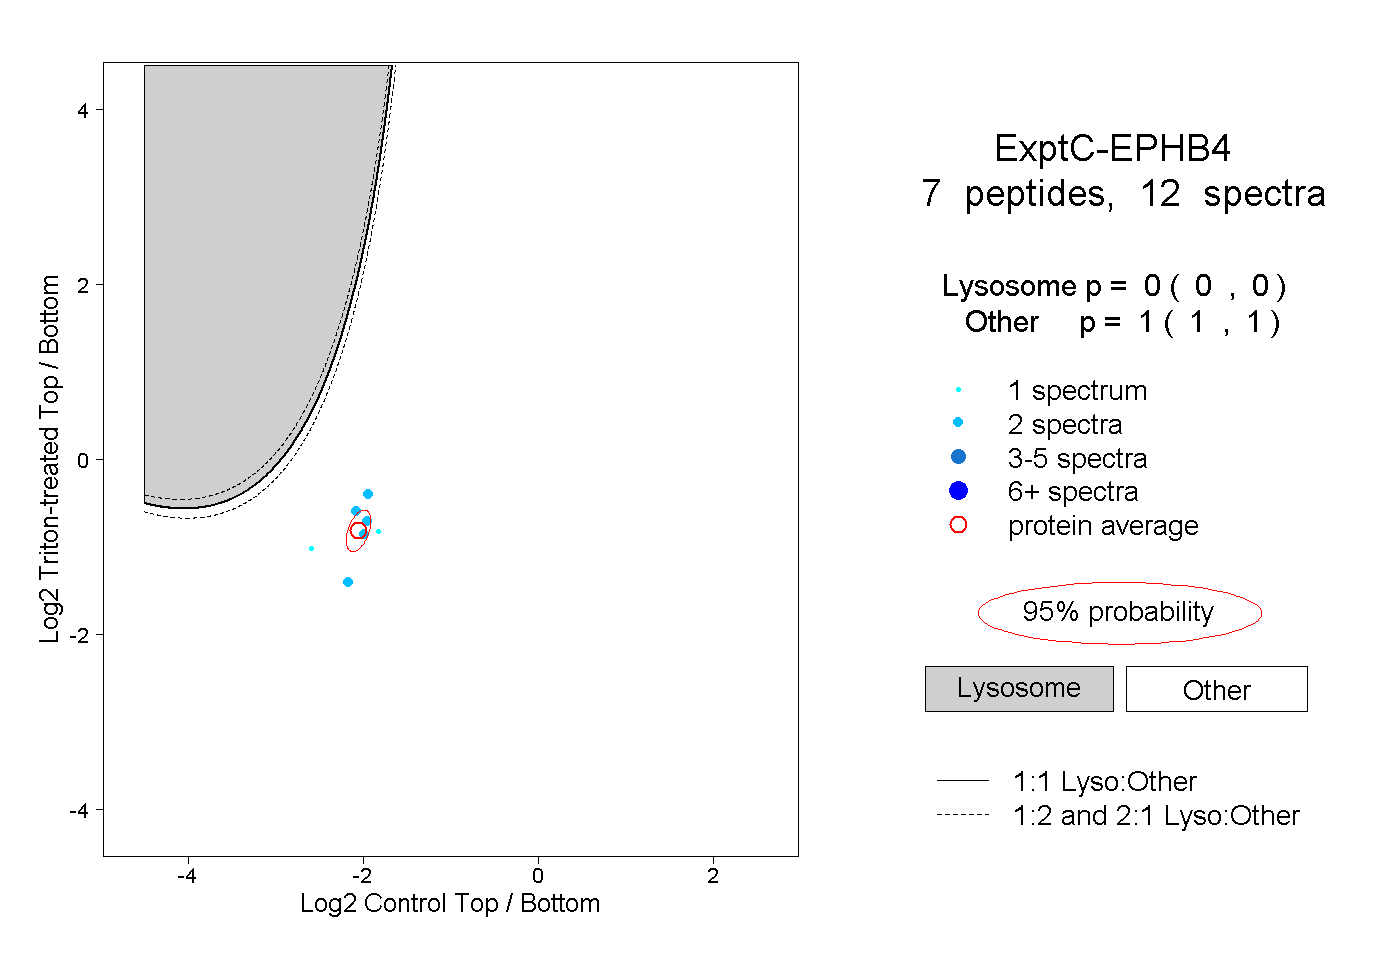 |
0.000 0.000 | 0.000 |
1.000 1.000 | 1.000 |