 4
4peptides
spectra
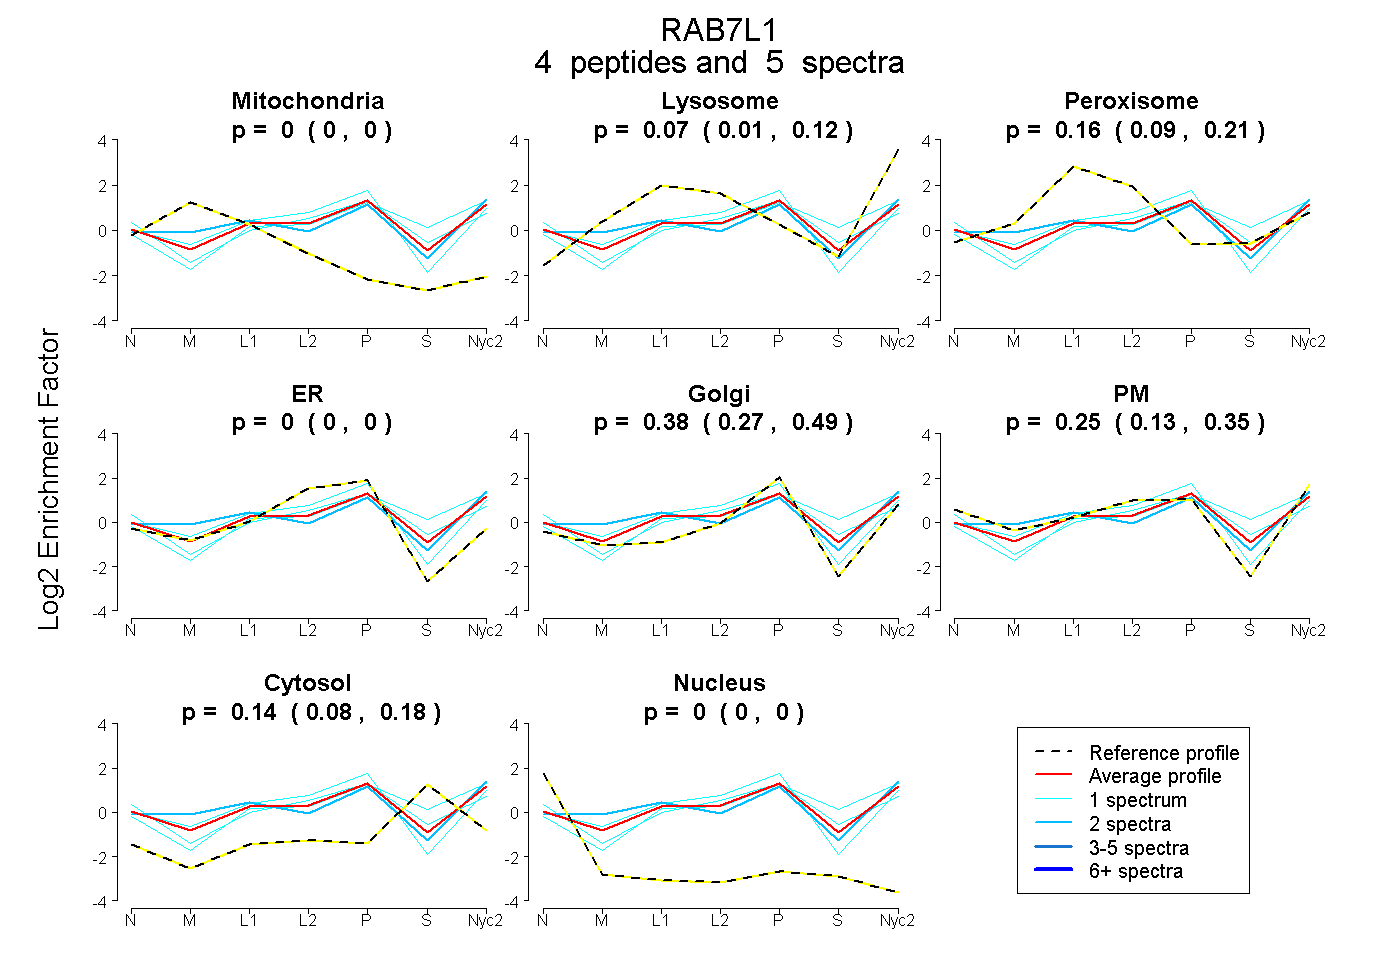
0.000 | 0.000
0.014 | 0.123
0.089 | 0.214
0.000 | 0.000
0.274 | 0.485
0.129 | 0.348
0.079 | 0.182
0.000 | 0.000
8peptides
spectra
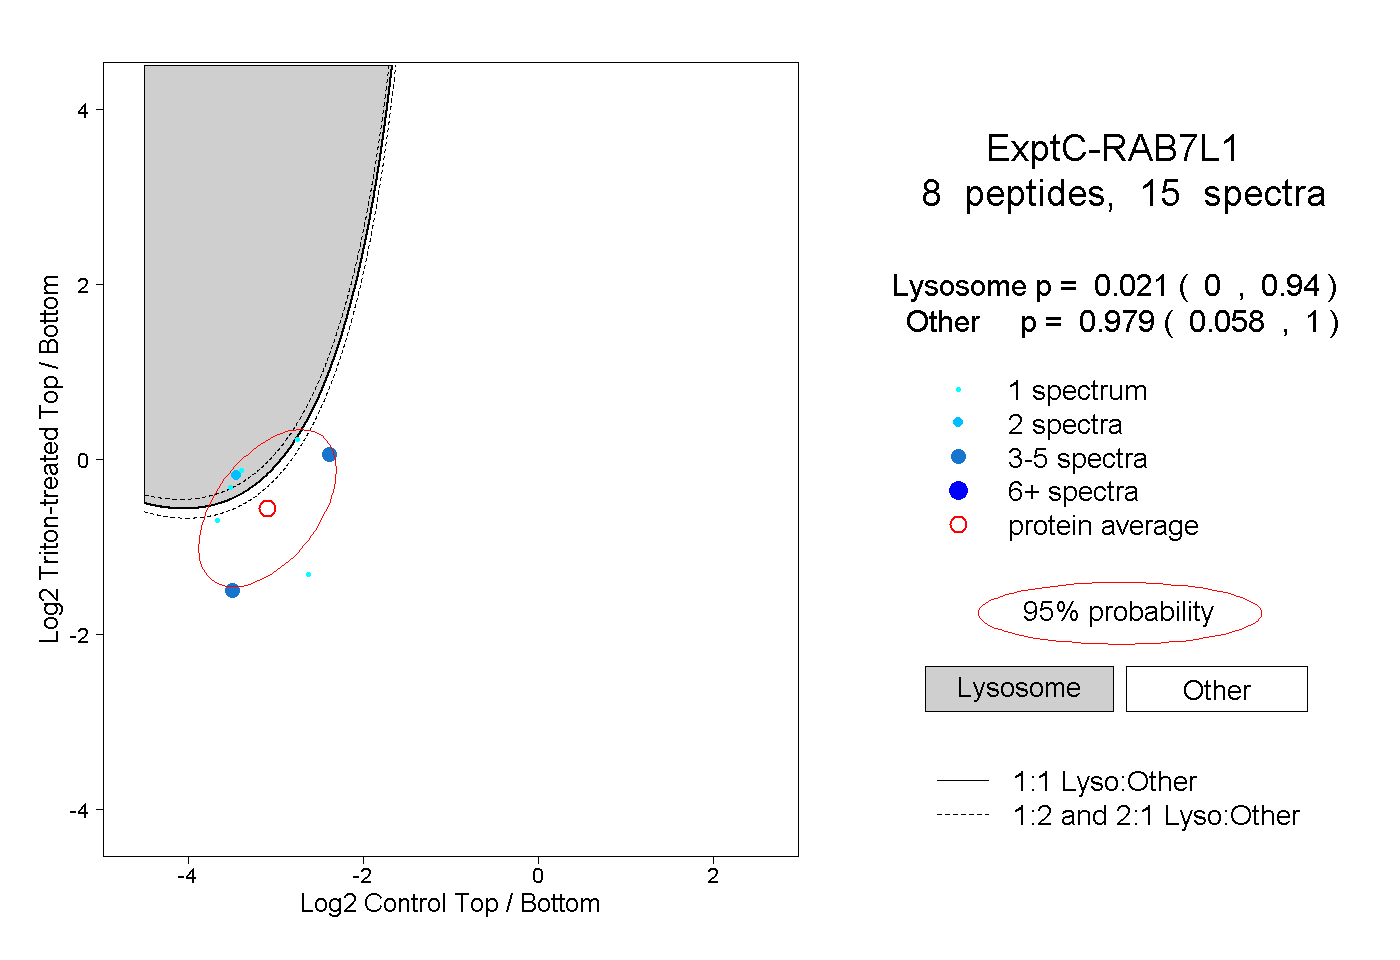
0.000 | 0.940
0.058 | 1.000
1peptide
spectrum
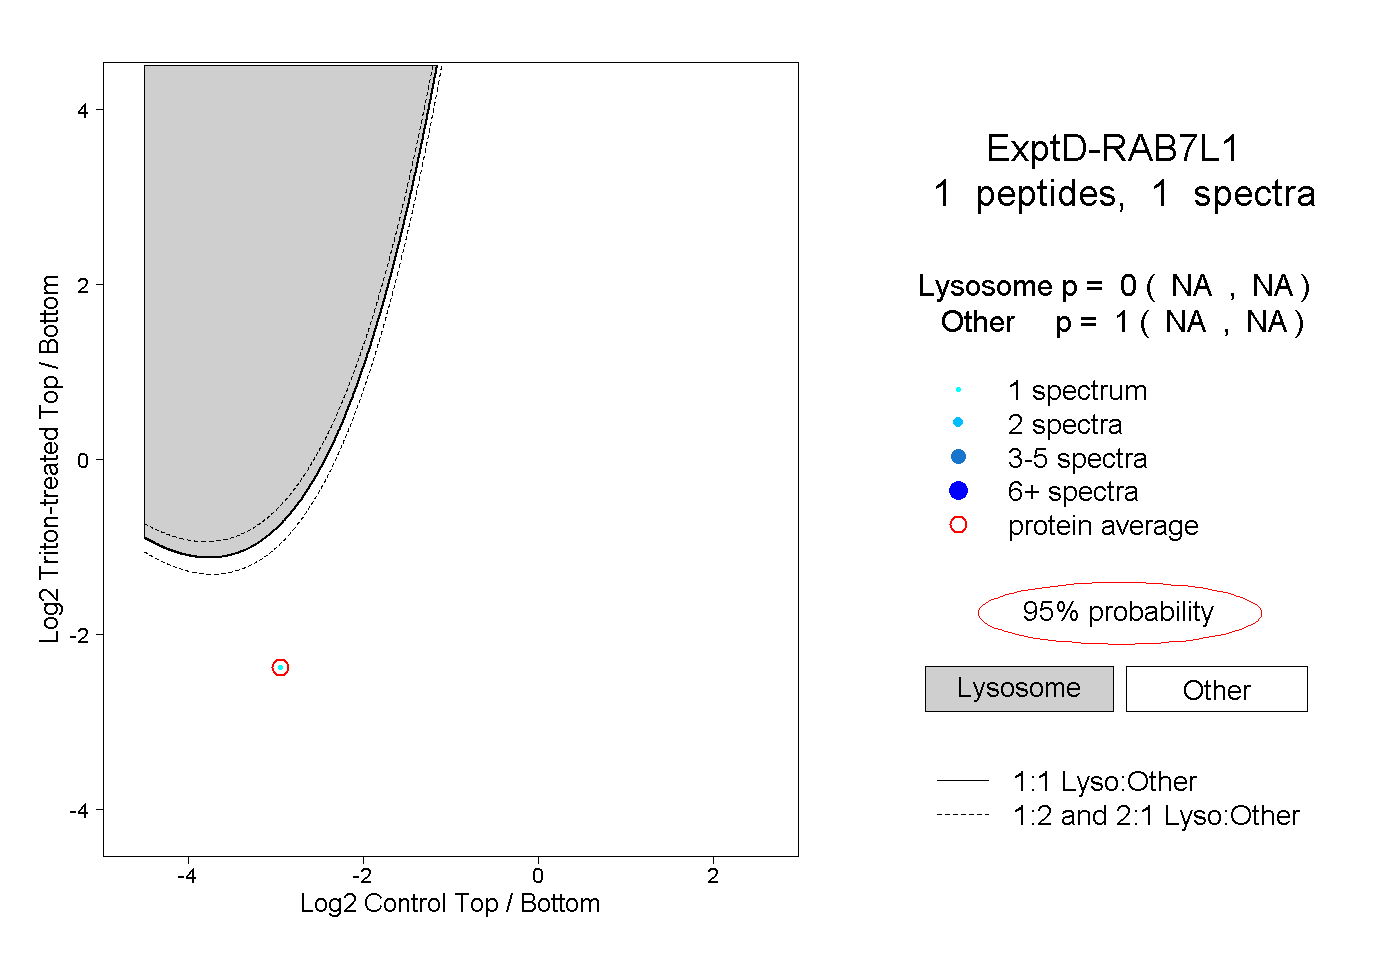
NA | NA
NA | NA