 4
4peptides
spectra
0.000 | 0.000
0.014 | 0.123
0.089 | 0.214
0.000 | 0.000
0.274 | 0.485
0.129 | 0.348
0.079 | 0.182
0.000 | 0.000
| Plot | Mito | Lyso | Perox | ER | Golgi | PM | Cytosol | Nucleus | |||||
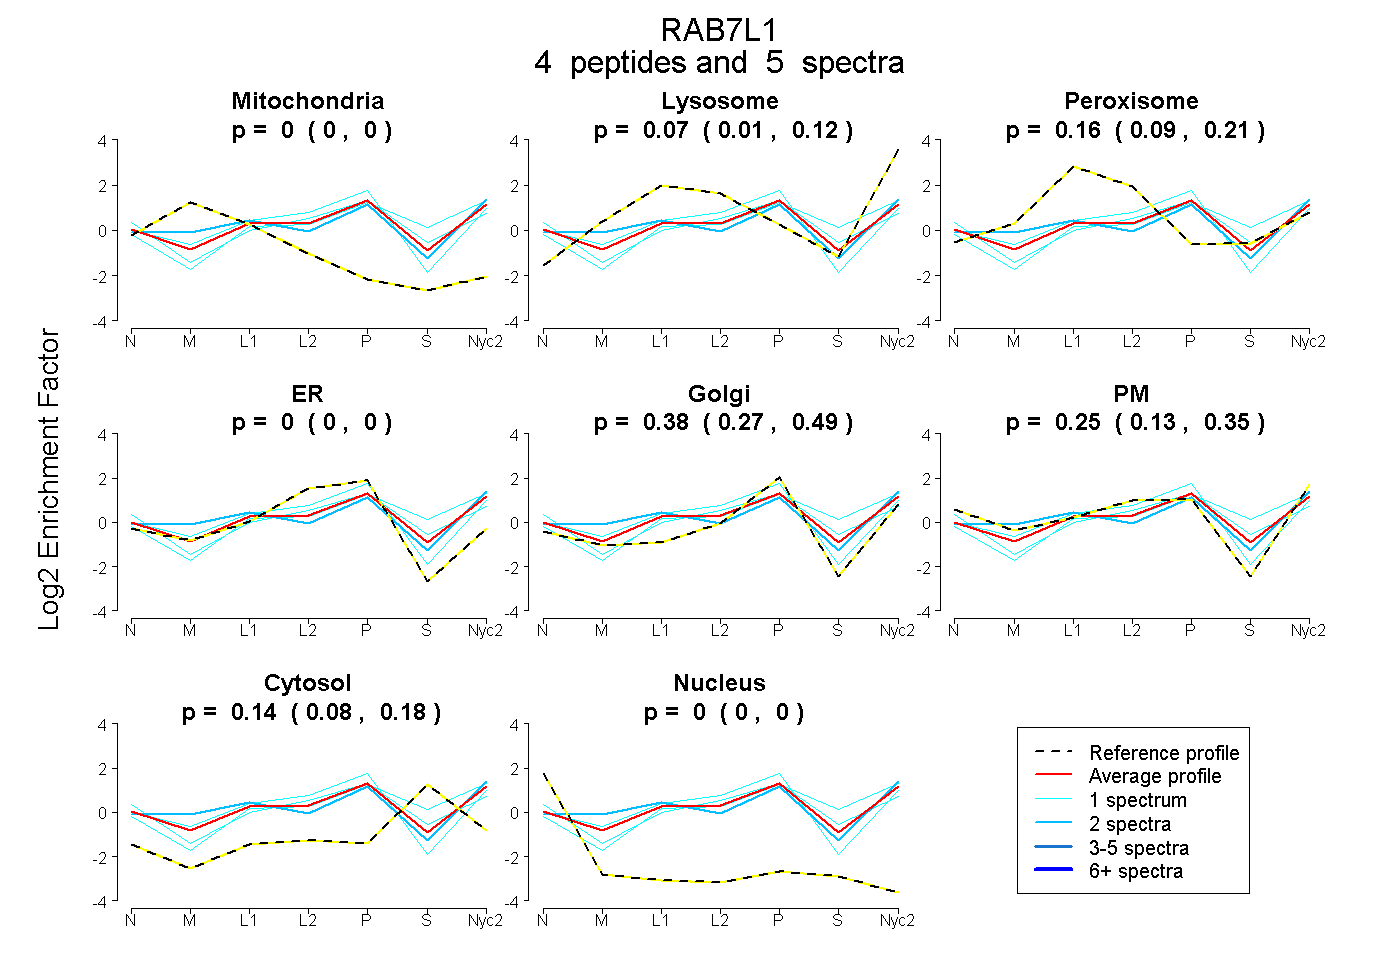
| Expt A |
4 peptides |
5 spectra |
|
0.000 0.000 | 0.000 |
0.072 0.014 | 0.123 |
0.155 0.089 | 0.214 |
0.000 0.000 | 0.000 |
0.381 0.274 | 0.485 |
0.253 0.129 | 0.348 |
0.139 0.079 | 0.182 |
0.000 0.000 | 0.000 |
| 2 spectra, YSQDSFSK | 0.038 | 0.184 | 0.097 | 0.000 | 0.380 | 0.221 | 0.080 | 0.000 | ||
| 1 spectrum, STVGVDFALK | 0.000 | 0.217 | 0.016 | 0.000 | 0.241 | 0.192 | 0.334 | 0.000 | ||
| 1 spectrum, SDLSPWAVSR | 0.000 | 0.000 | 0.055 | 0.124 | 0.122 | 0.435 | 0.264 | 0.000 | ||
| 1 spectrum, FTSMTR | 0.000 | 0.032 | 0.153 | 0.163 | 0.412 | 0.239 | 0.000 | 0.000 |
| Plot | Lyso | Other | |||||||||||
| Expt C |
8 peptides |
15 spectra |
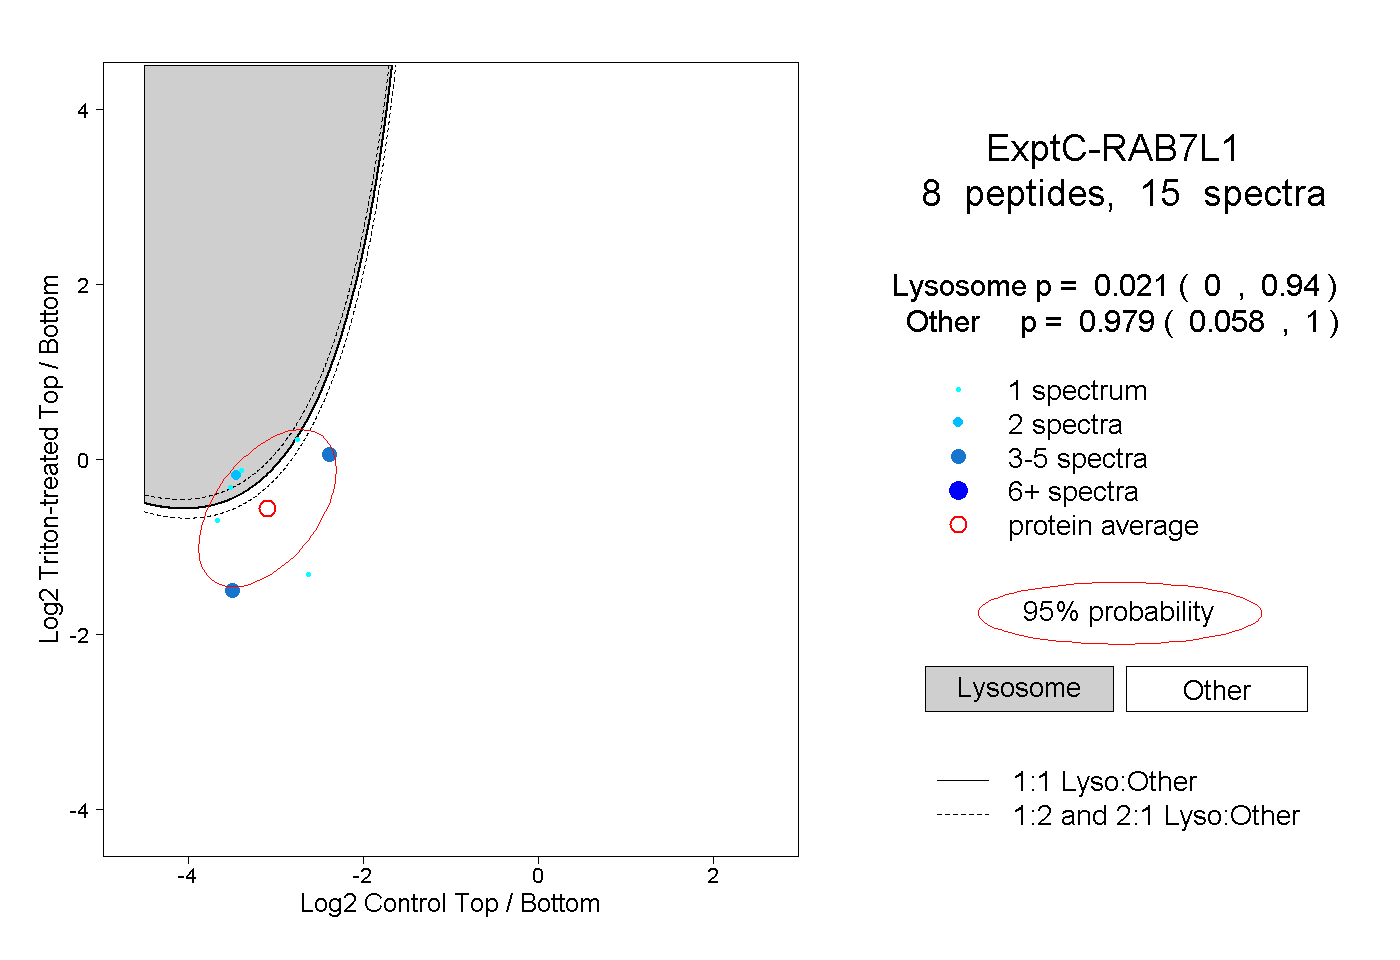 |
0.021 0.000 | 0.940 |
0.979 0.058 | 1.000 |
||||||||
| Plot | Lyso | Other | |||||||||||
| Expt D |
1 peptide |
1 spectrum |
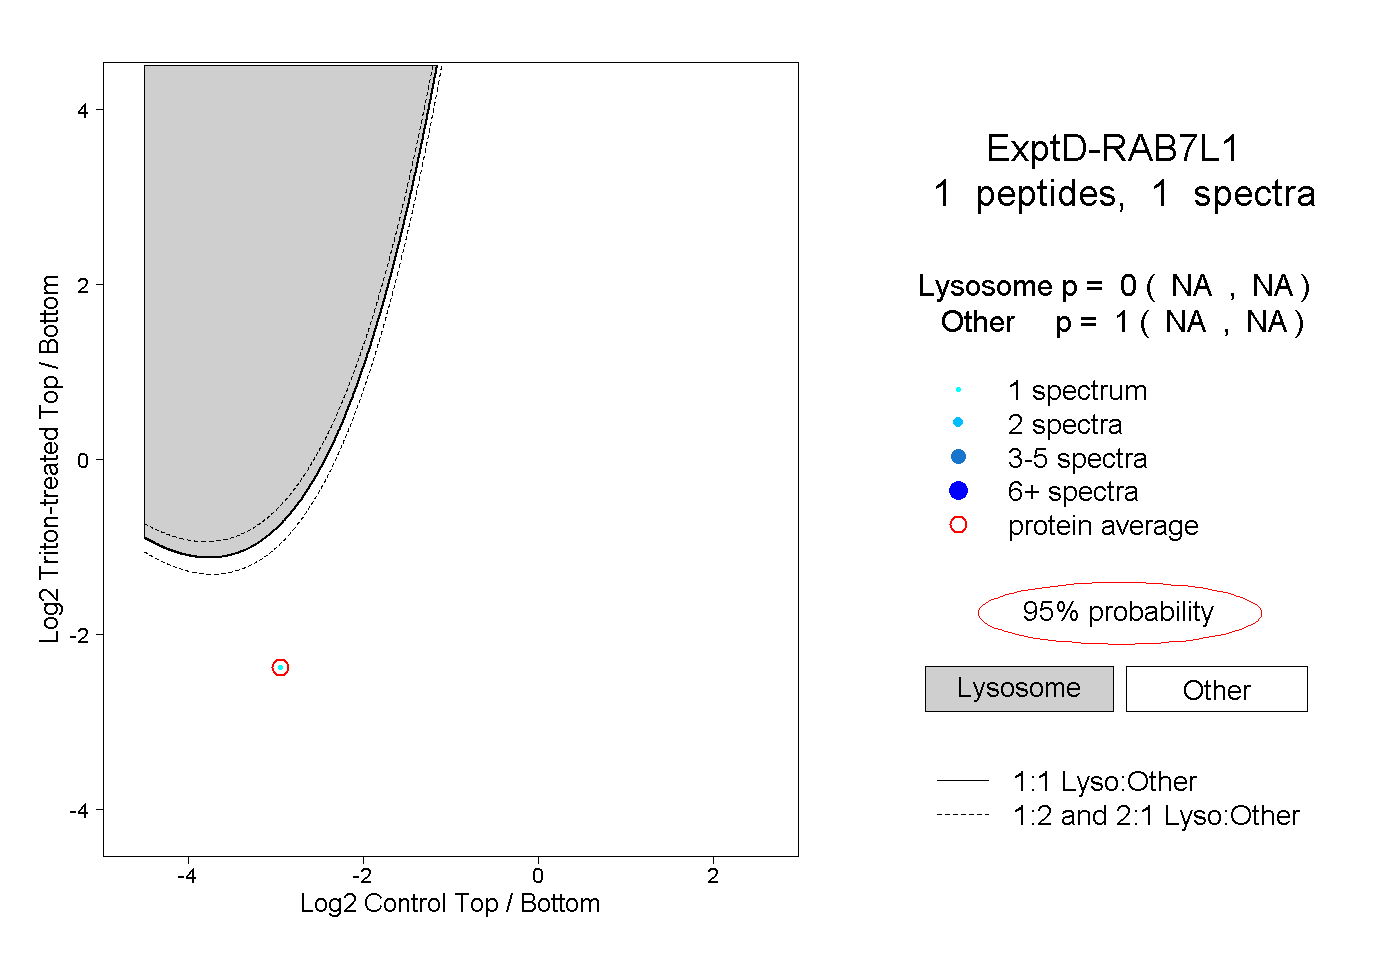 |
0.000 NA | NA |
1.000 NA | NA |