 3
3peptides
spectra
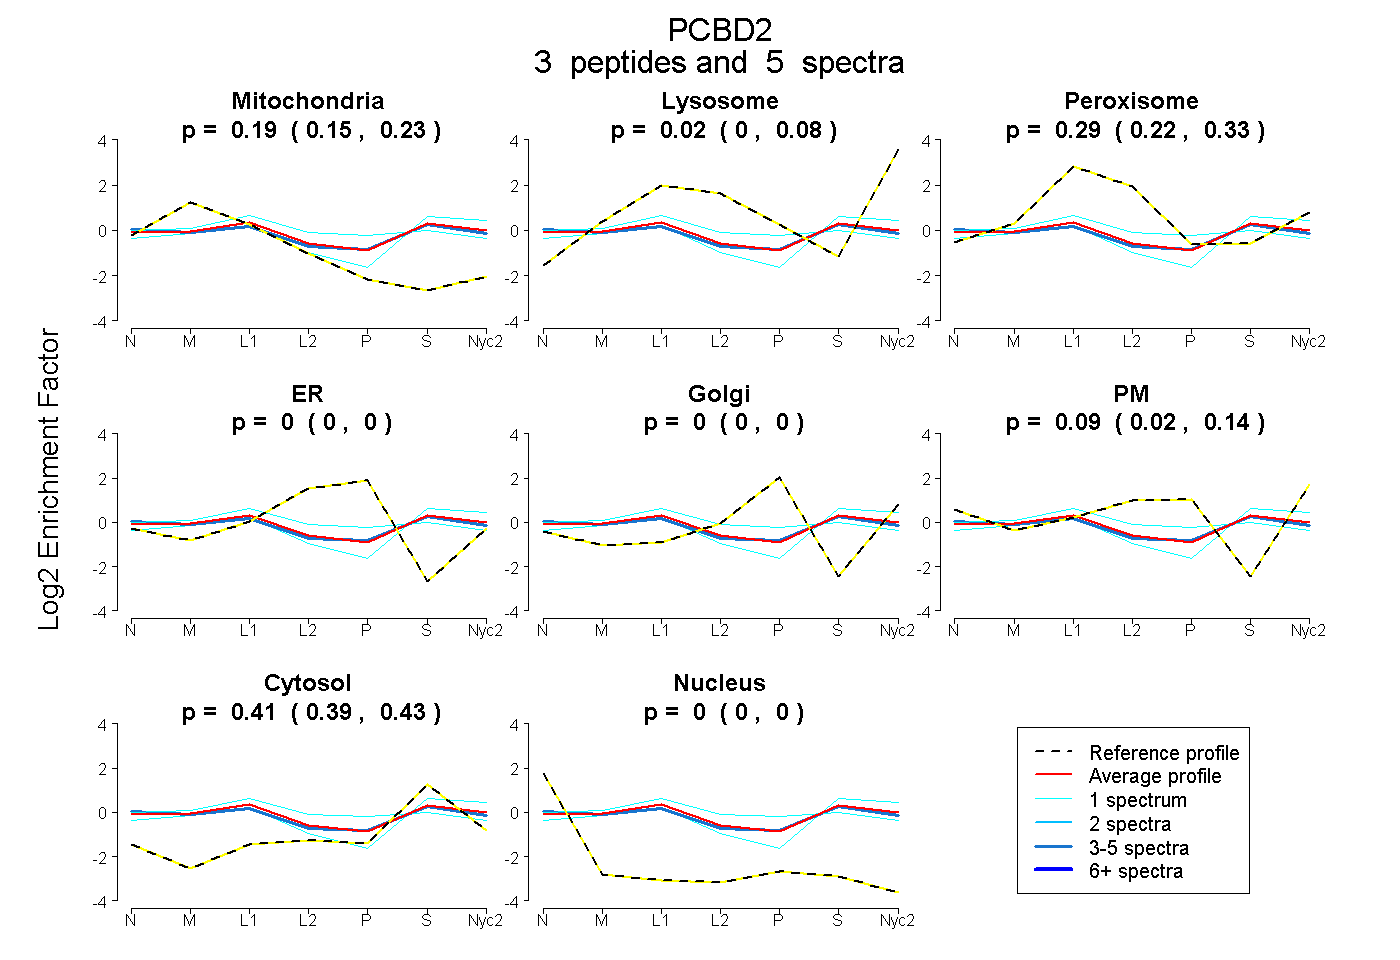
0.150 | 0.233
0.000 | 0.082
0.215 | 0.332
0.000 | 0.000
0.000 | 0.000
0.016 | 0.142
0.385 | 0.428
0.000 | 0.000
1peptide
spectrum
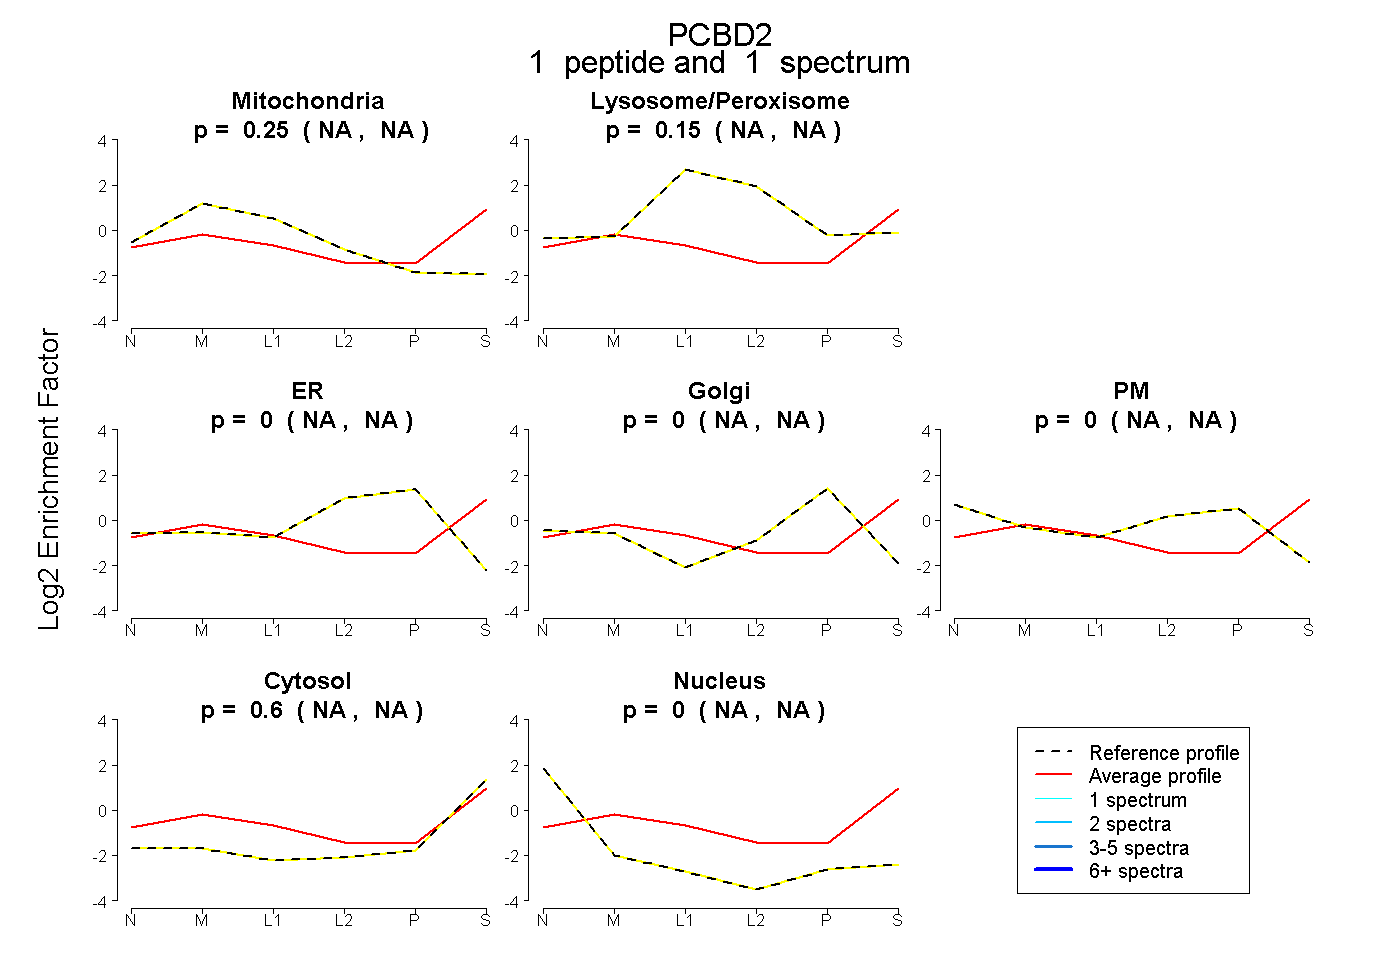
NA | NA
NA | NA
NA | NA
NA | NA
NA | NA
NA | NA
NA | NA
4peptides
spectra
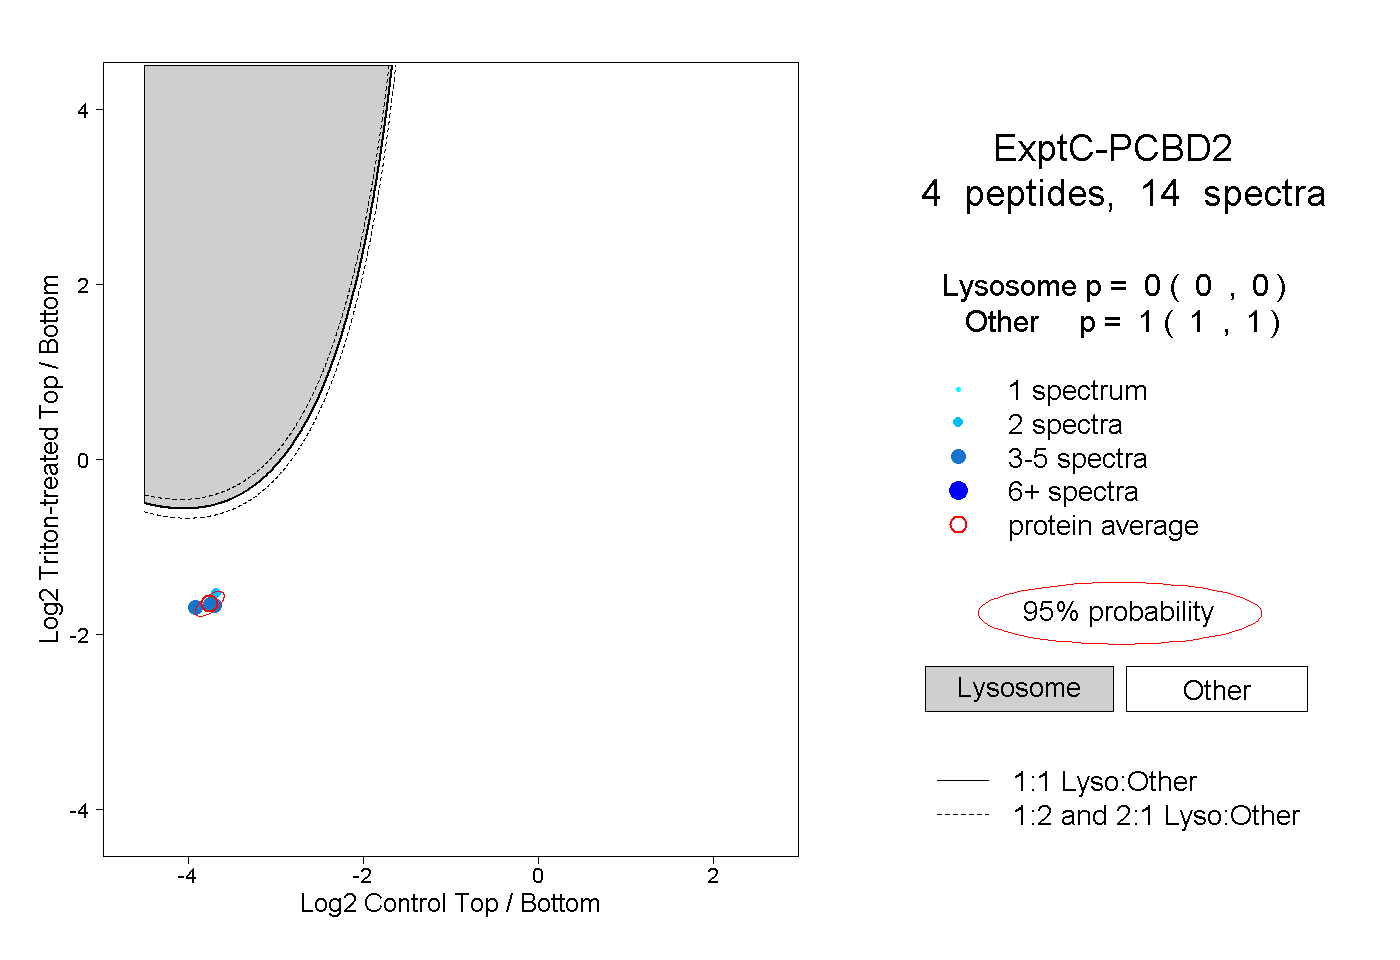
0.000 | 0.000
1.000 | 1.000