 3
3peptides
spectra
0.150 | 0.233
0.000 | 0.082
0.215 | 0.332
0.000 | 0.000
0.000 | 0.000
0.016 | 0.142
0.385 | 0.428
0.000 | 0.000
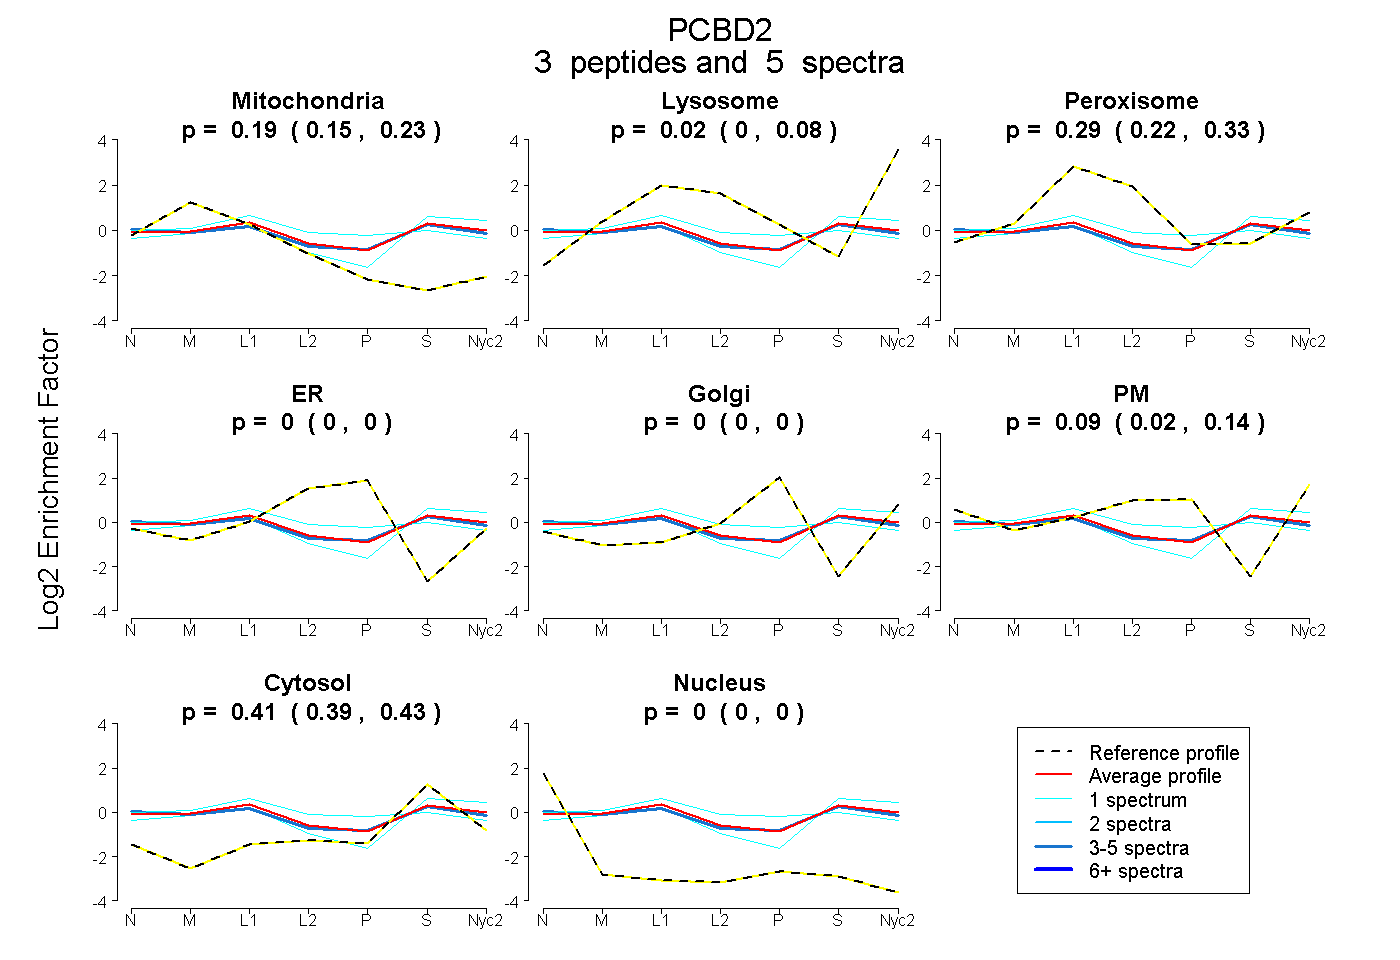
| Plot | Mito | Lyso | Perox | ER | Golgi | PM | Cytosol | Nucleus | |||||
| Expt A |
3 peptides |
5 spectra |
|
0.192 0.150 | 0.233 |
0.022 0.000 | 0.082 |
0.286 0.215 | 0.332 |
0.000 0.000 | 0.000 |
0.000 0.000 | 0.000 |
0.090 0.016 | 0.142 |
0.409 0.385 | 0.428 |
0.000 0.000 | 0.000 |
| 1 spectrum, AAGWSELSER | 0.214 | 0.177 | 0.130 | 0.000 | 0.000 | 0.000 | 0.479 | 0.000 | ||
| 1 spectrum, VQITLTSHDCGGLSK | 0.178 | 0.000 | 0.392 | 0.000 | 0.123 | 0.027 | 0.280 | 0.000 | ||
| 3 spectra, NFNQAFGFMSR | 0.205 | 0.000 | 0.241 | 0.000 | 0.000 | 0.132 | 0.422 | 0.000 |
| Plot | Mito | Lyso or Perox | ER | Golgi | PM | Cytosol | Nucleus | ||||||
| Expt B |
1 peptide |
1 spectrum |
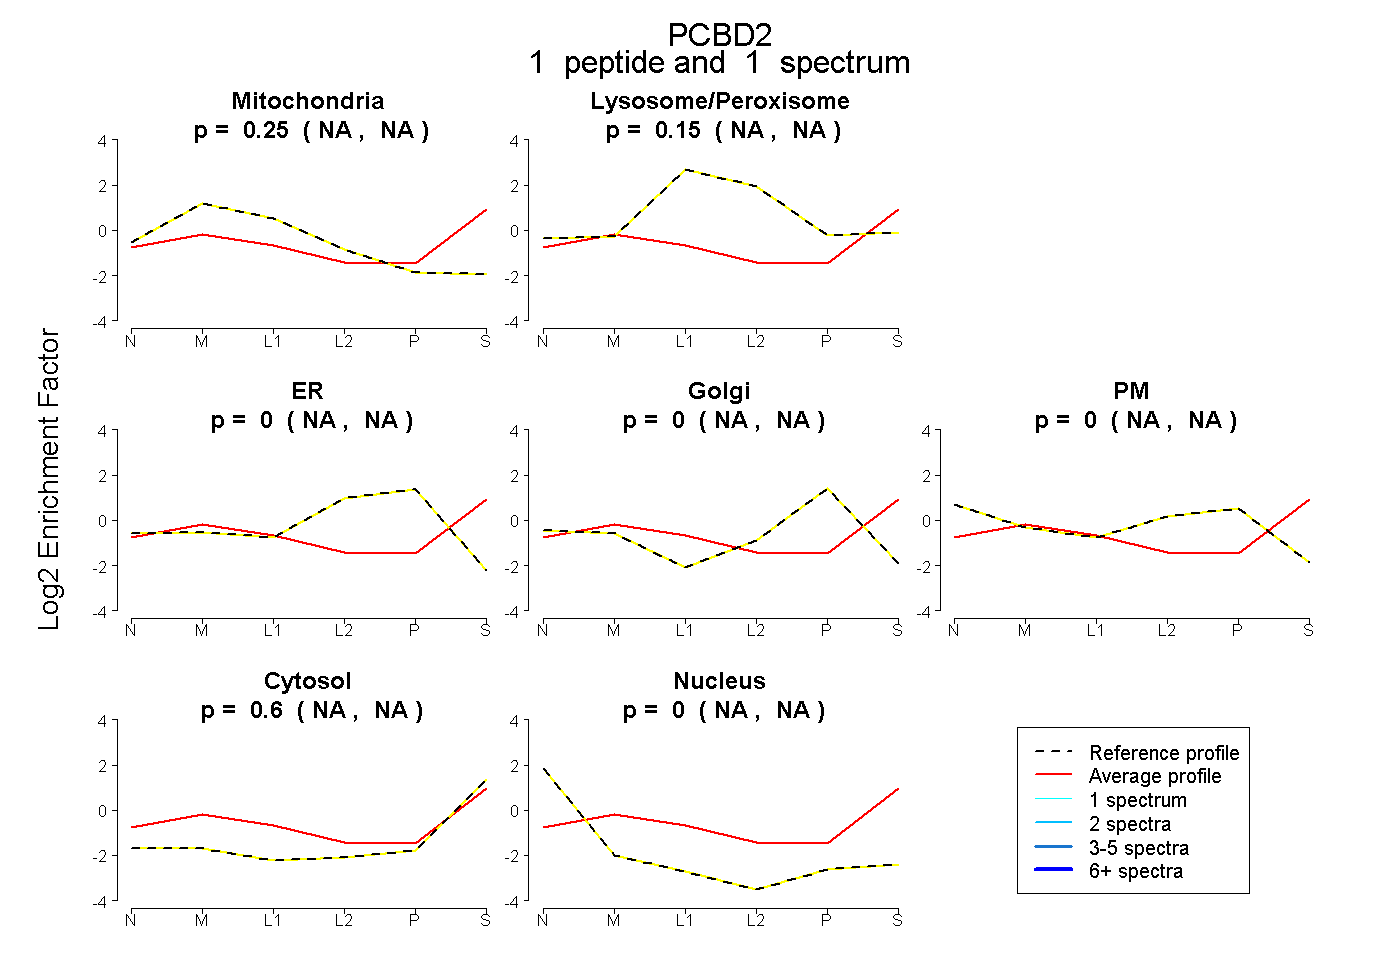 |
0.250 NA | NA |
0.153 NA | NA |
0.000 NA | NA |
0.000 NA | NA |
0.000 NA | NA |
0.597 NA | NA |
0.000 NA | NA |
|||
| Plot | Lyso | Other | |||||||||||
| Expt C |
4 peptides |
14 spectra |
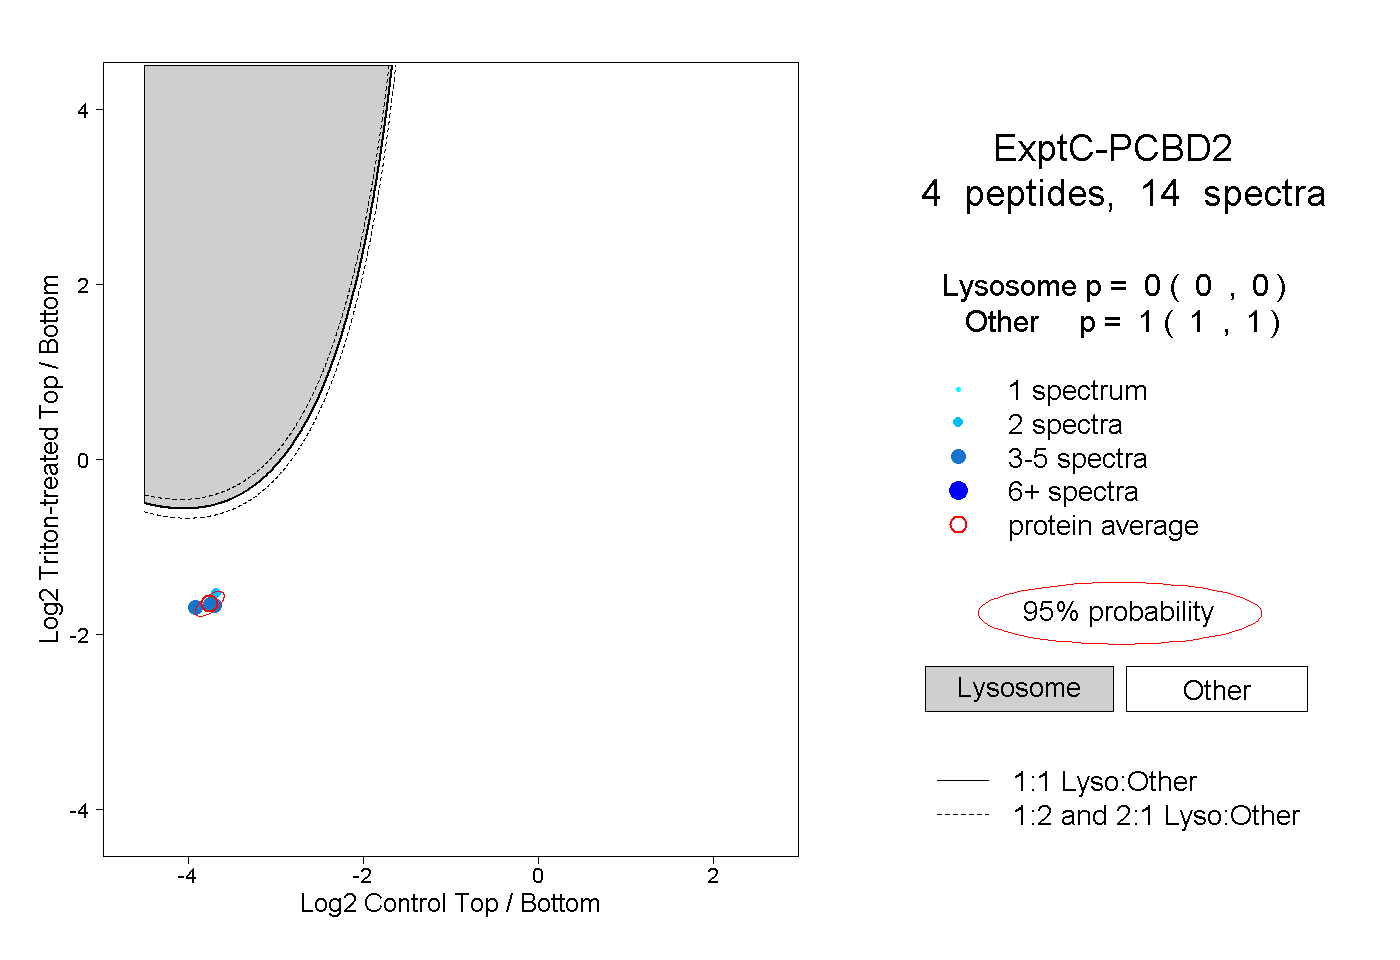 |
0.000 0.000 | 0.000 |
1.000 1.000 | 1.000 |