 5
5peptides
spectra
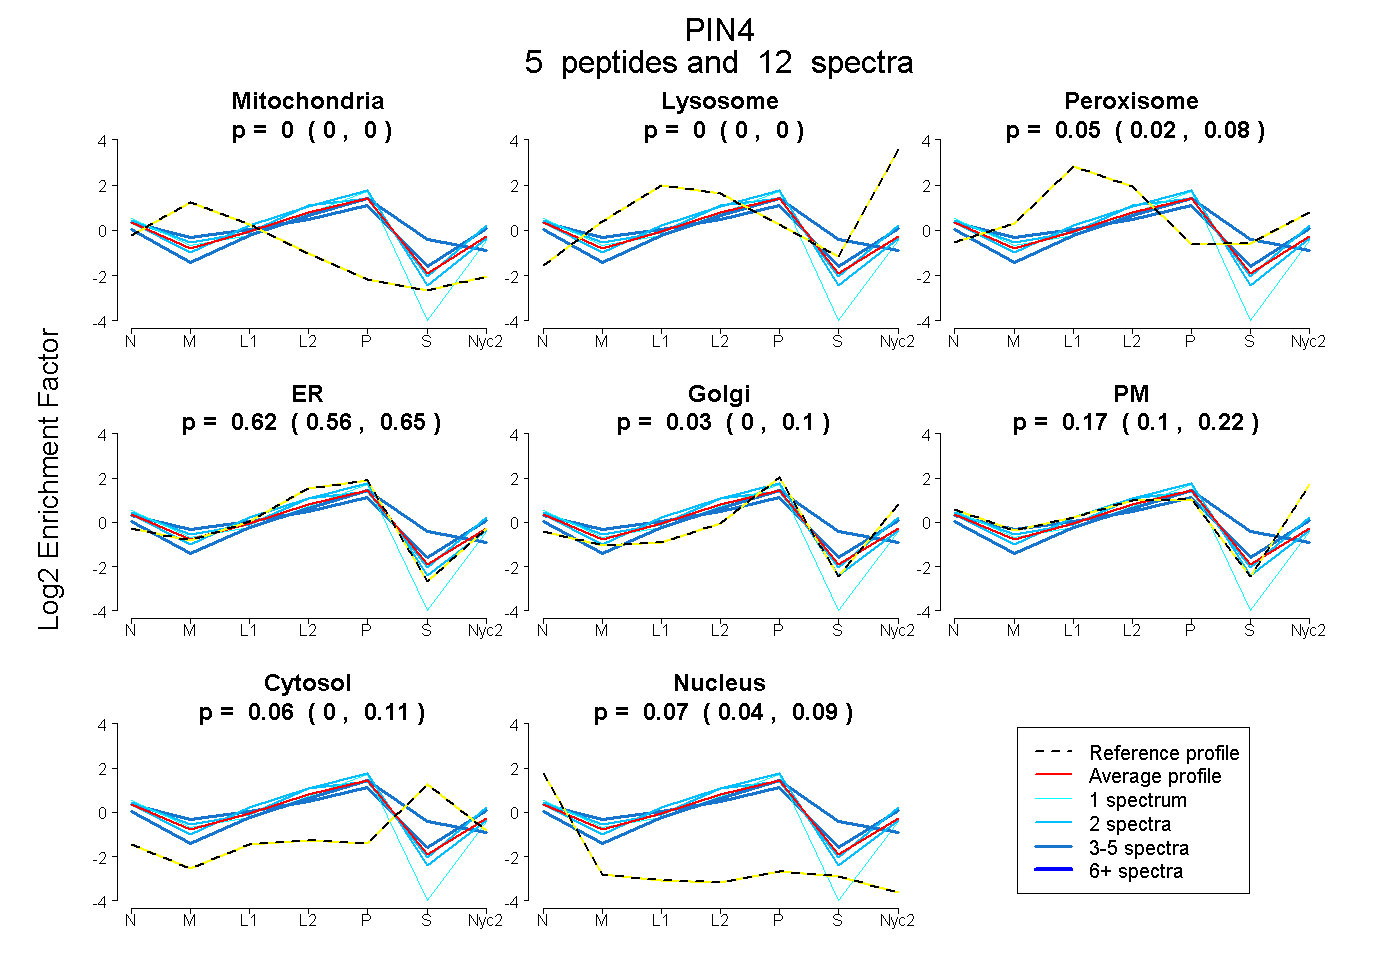
0.000 | 0.000
0.000 | 0.000
0.023 | 0.084
0.557 | 0.652
0.000 | 0.103
0.102 | 0.216
0.000 | 0.115
0.039 | 0.092
3peptides
spectra
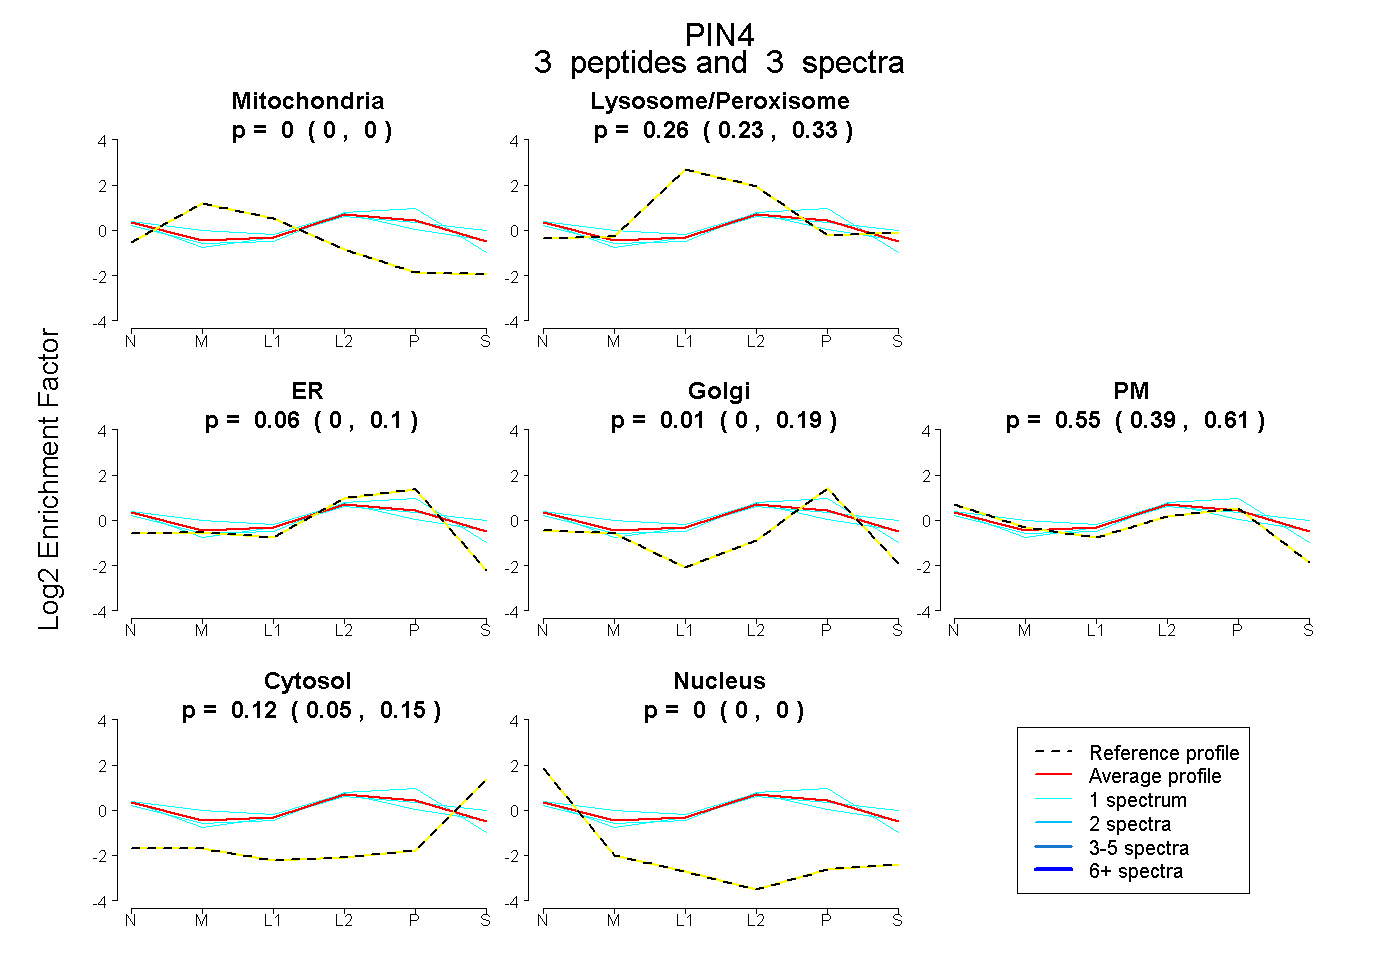
0.000 | 0.000
0.230 | 0.326
0.000 | 0.104
0.000 | 0.188
0.390 | 0.609
0.045 | 0.155
0.000 | 0.000
4peptides
spectra
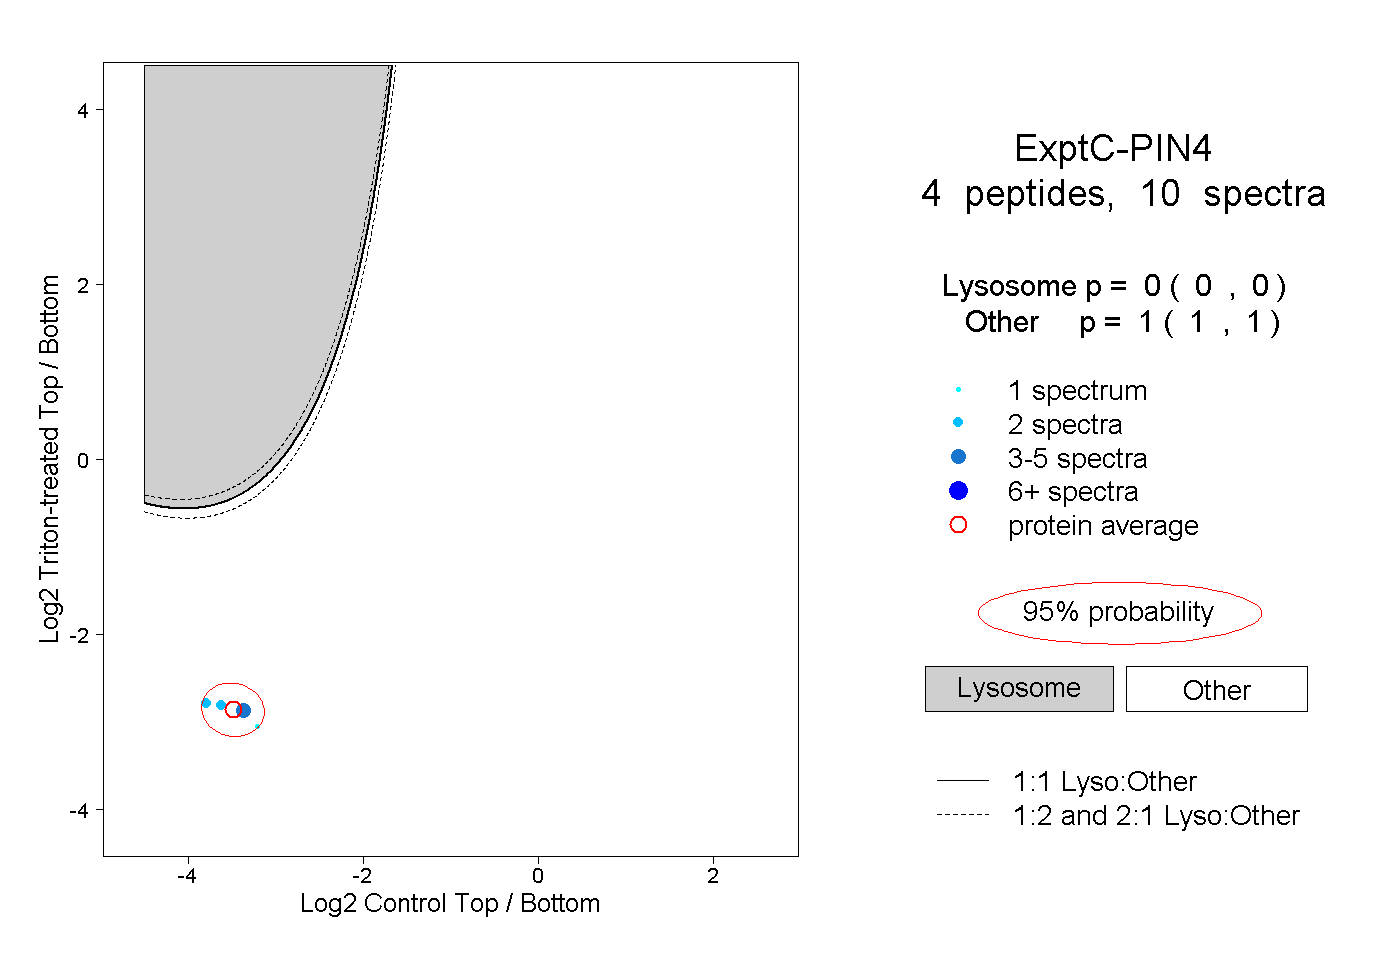
0.000 | 0.000
1.000 | 1.000