PIN4
[ENSRNOP00000067375]
Main page
| | | Plot |
Mito |
Lyso |
|
Perox |
ER |
Golgi |
PM |
Cytosol |
Nucleus |
|
| Expt A |
 5
5
peptides |
12
spectra |
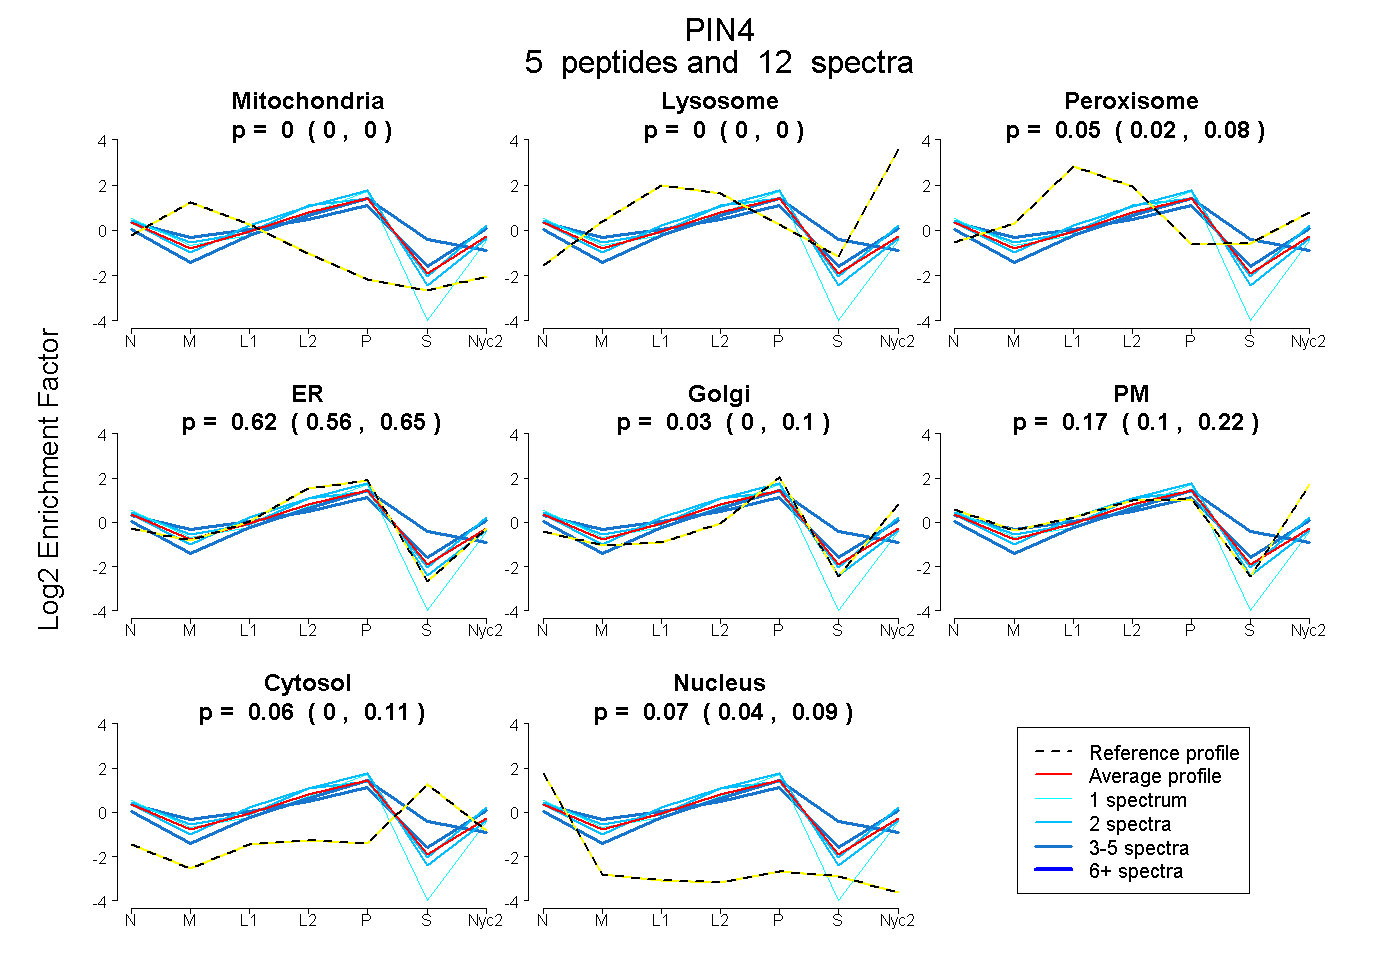 |
0.000
0.000 | 0.000 |
0.000
0.000 | 0.000 |
|
0.049
0.023 | 0.084 |
0.617
0.557 | 0.652 |
0.027
0.000 | 0.103 |
0.174
0.102 | 0.216 |
0.065
0.000 | 0.115 |
0.068
0.039 | 0.092 |
|
| | | Plot |
Mito |
|
Lyso or Perox |
|
ER |
Golgi |
PM |
Cytosol |
Nucleus |
|
| Expt B |
3
peptides |
3
spectra |
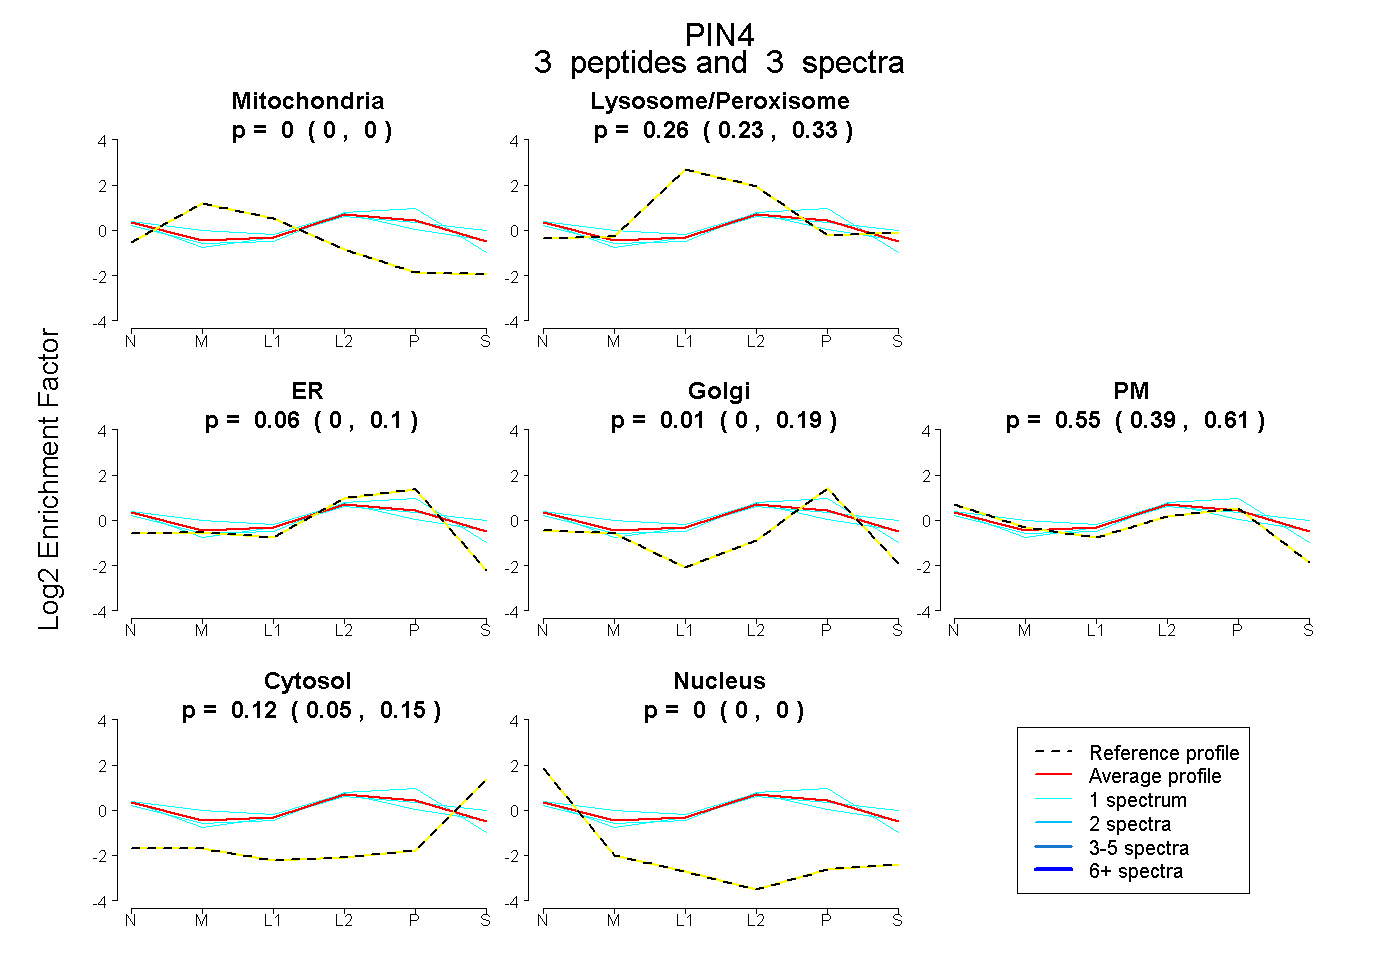 |
0.000
0.000 | 0.000 |
|
0.264
0.230 | 0.326 |
|
0.058
0.000 | 0.104 |
0.006
0.000 | 0.188 |
0.552
0.390 | 0.609 |
0.120
0.045 | 0.155 |
0.000
0.000 | 0.000 |
|
| 1 spectrum, HILCEK |
0.000 |
|
0.299 |
|
0.000 |
0.000 |
0.507 |
0.194 |
0.000 |
|
| 1 spectrum, FGYHIIMVEGR |
0.000 |
|
0.311 |
|
0.000 |
0.000 |
0.575 |
0.115 |
0.000 |
|
| 1 spectrum, FSEVATQYSEDK |
0.000 |
|
0.224 |
|
0.229 |
0.165 |
0.354 |
0.028 |
0.000 |
|
| | | Plot |
|
Lyso |
|
|
|
|
|
|
|
Other |
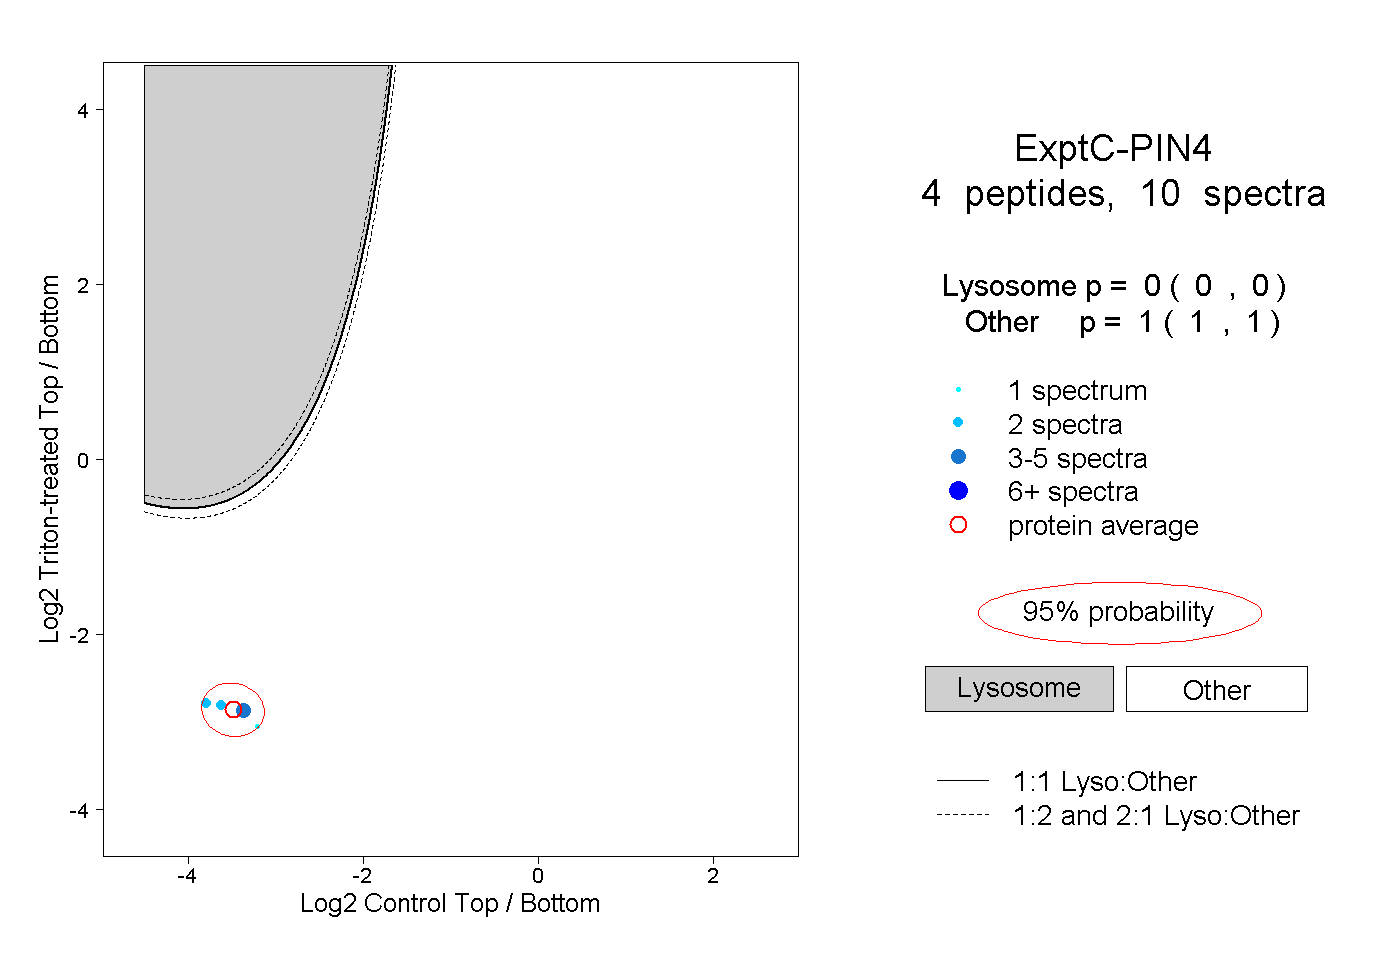
| Expt C |
4
peptides |
10
spectra |
 |
|
0.000
0.000 | 0.000 |
|
|
|
|
|
|
|
1.000
1.000 | 1.000 |