 2
2peptides
spectra
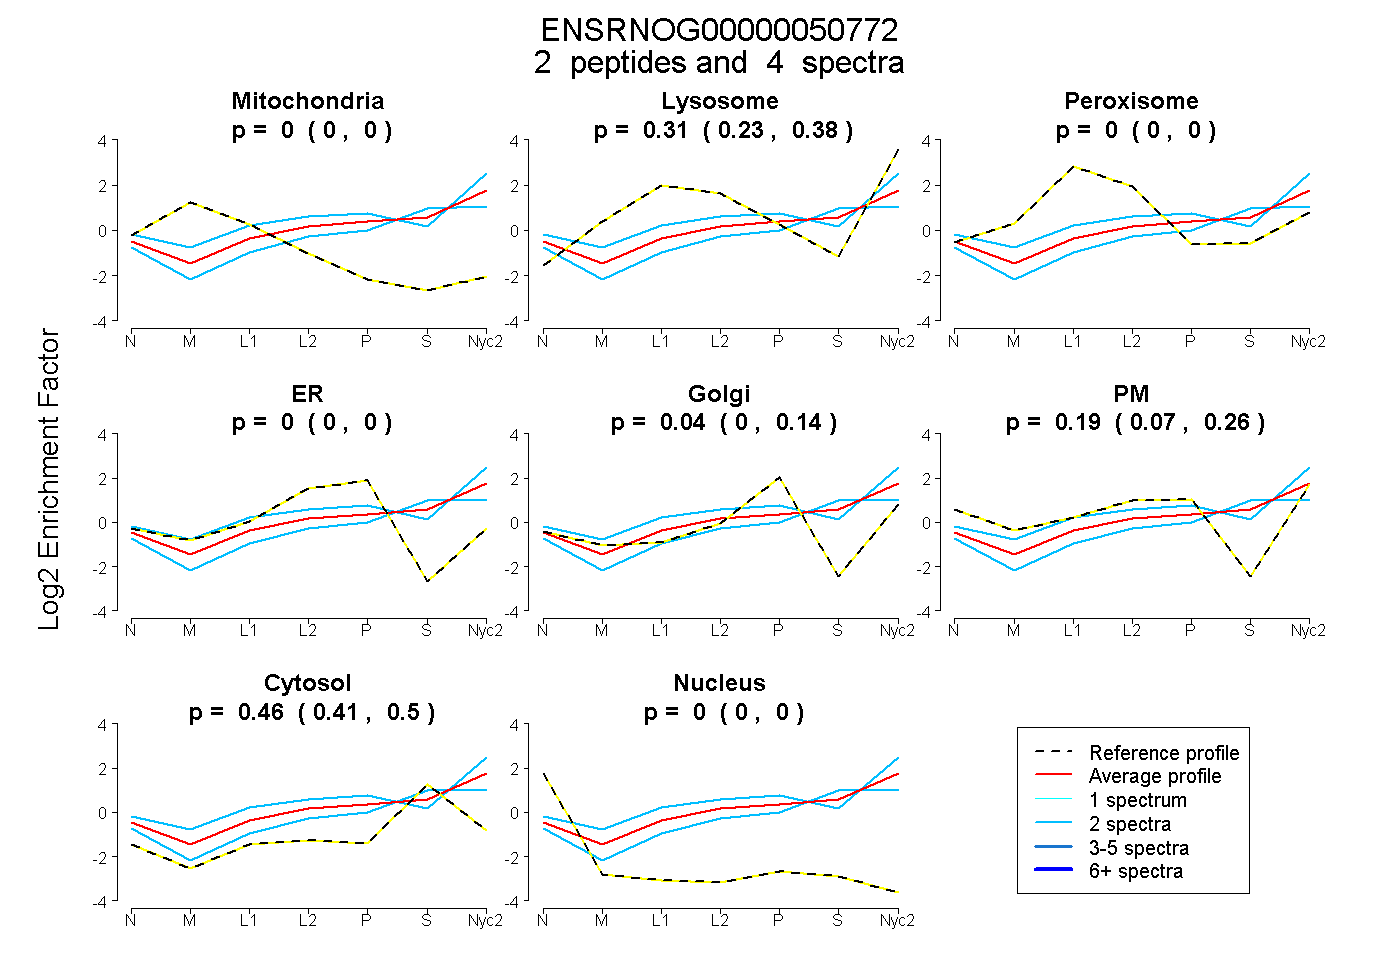
0.000 | 0.000
0.234 | 0.376
0.000 | 0.000
0.000 | 0.000
0.000 | 0.142
0.066 | 0.257
0.411 | 0.500
0.000 | 0.000
2peptides
spectra
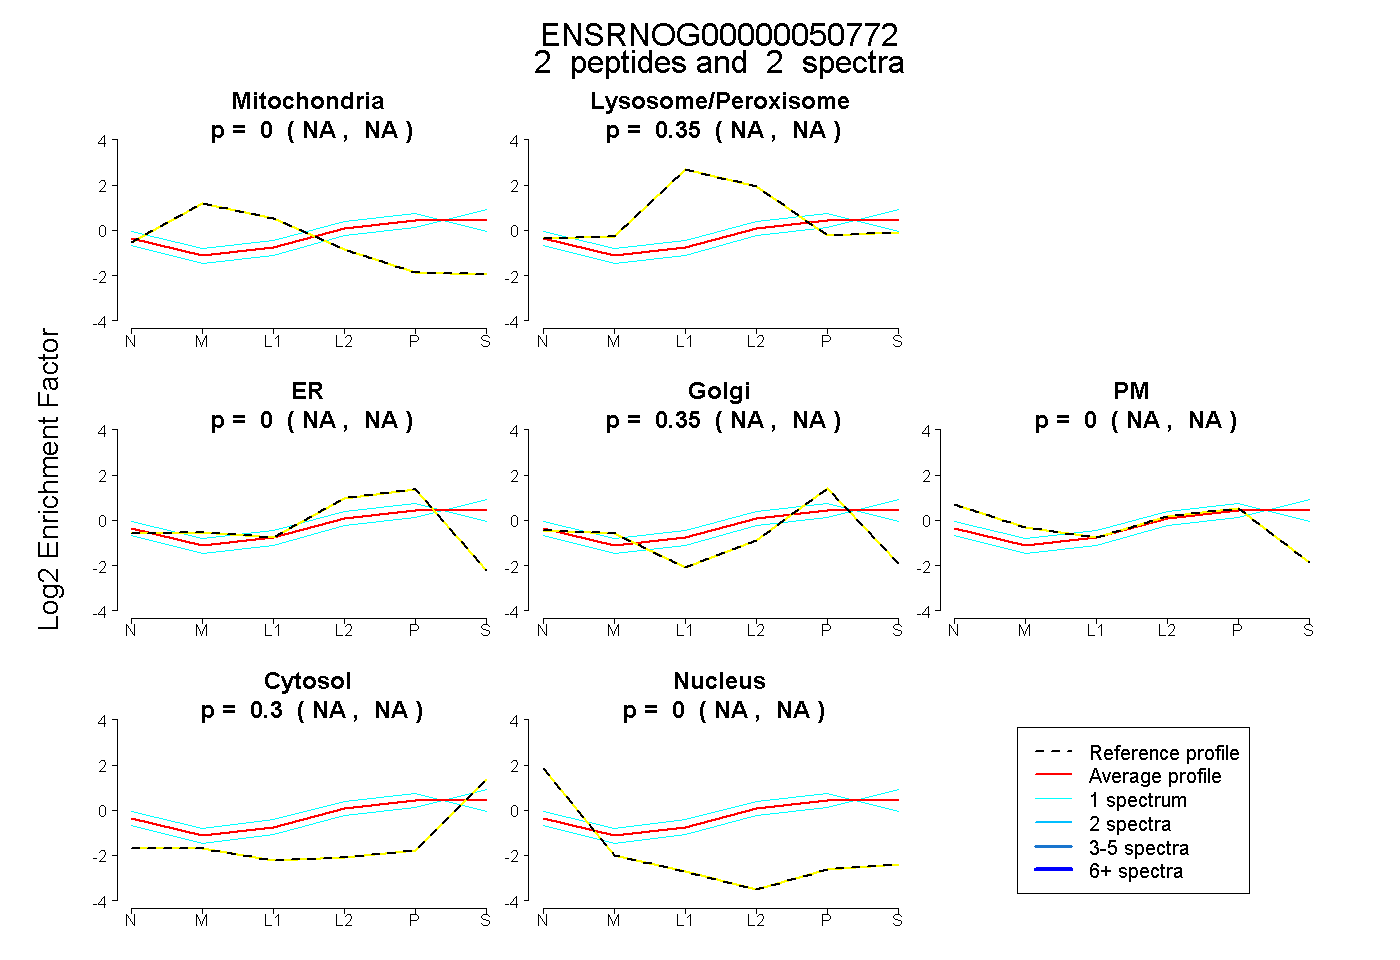
NA | NA
NA | NA
NA | NA
NA | NA
NA | NA
NA | NA
NA | NA
2peptides
spectra
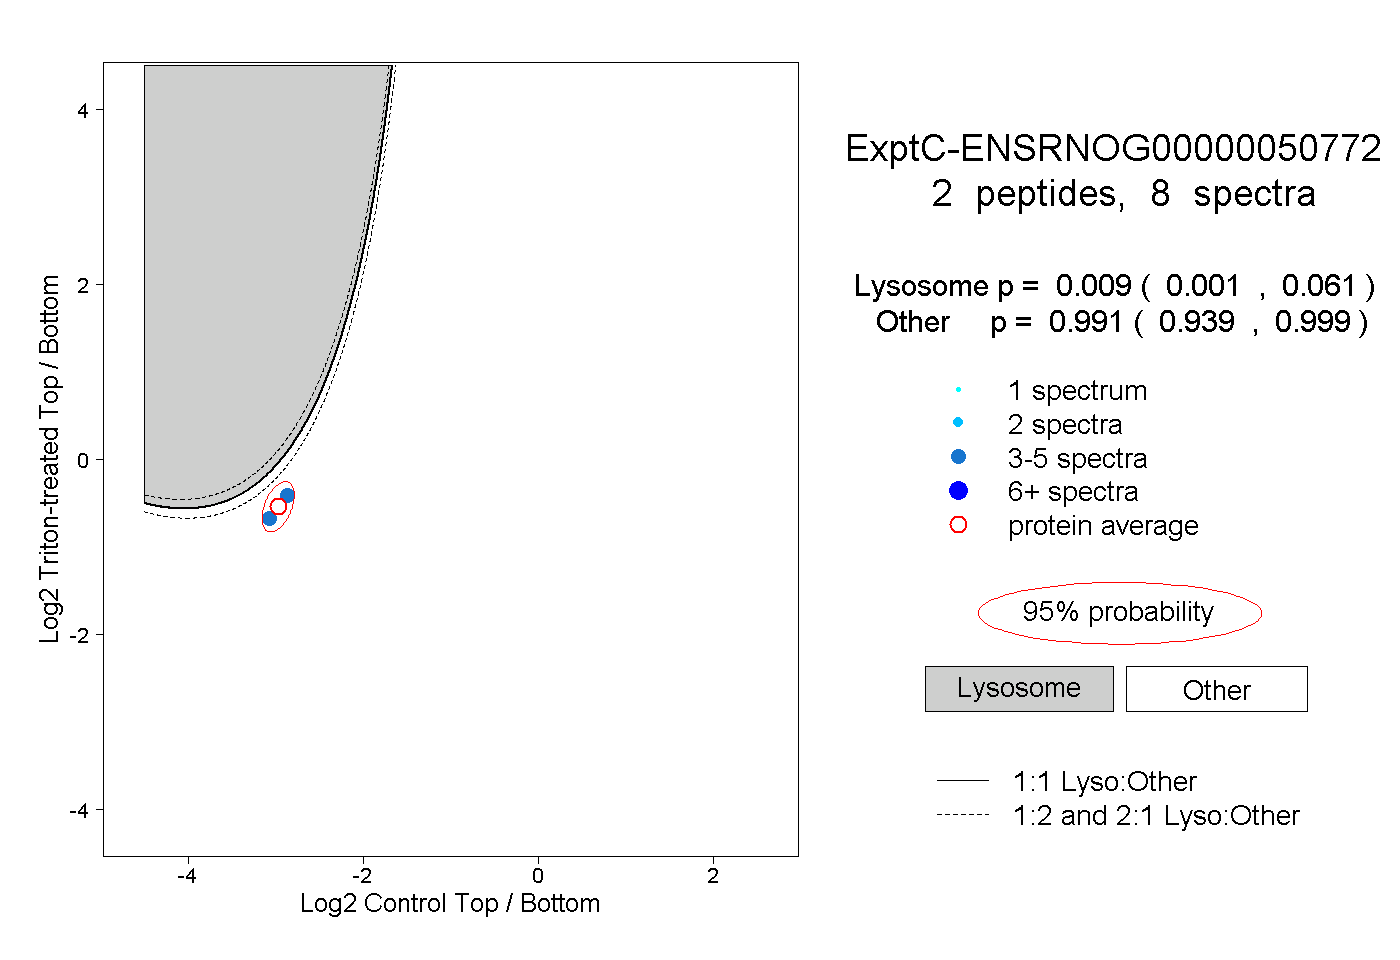
0.001 | 0.061
0.939 | 0.999