 2
2peptides
spectra
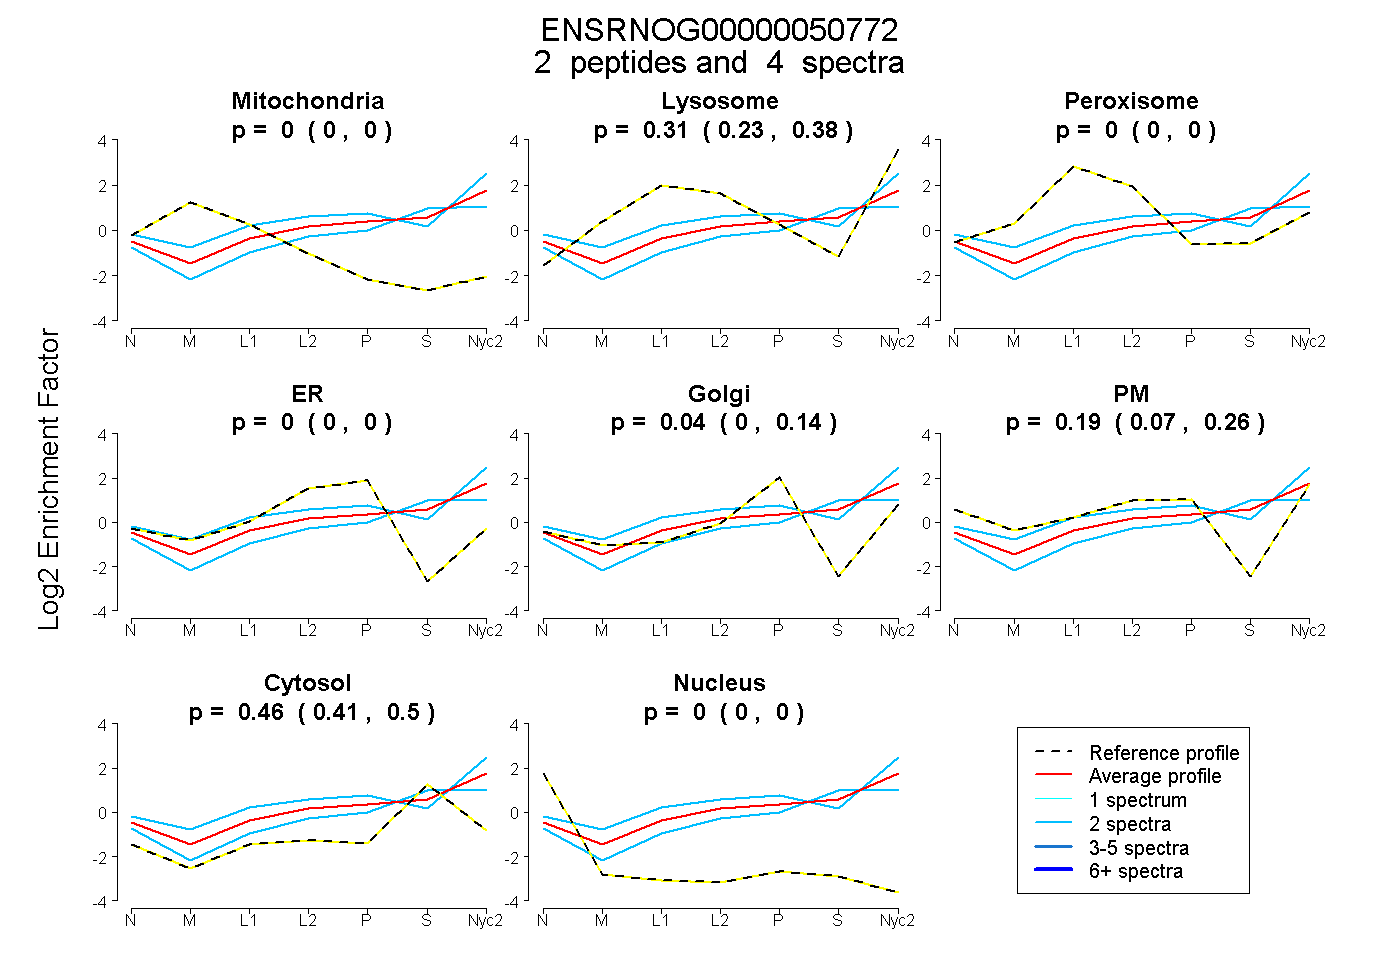
0.000 | 0.000
0.234 | 0.376
0.000 | 0.000
0.000 | 0.000
0.000 | 0.142
0.066 | 0.257
0.411 | 0.500
0.000 | 0.000
| Plot | Mito | Lyso | Perox | ER | Golgi | PM | Cytosol | Nucleus | |||||
| Expt A |
2 peptides |
4 spectra |
|
0.000 0.000 | 0.000 |
0.309 0.234 | 0.376 |
0.000 0.000 | 0.000 |
0.000 0.000 | 0.000 |
0.038 0.000 | 0.142 |
0.193 0.066 | 0.257 |
0.460 0.411 | 0.500 |
0.000 0.000 | 0.000 |
| 2 spectra, FSGVPDR | 0.000 | 0.195 | 0.000 | 0.000 | 0.101 | 0.059 | 0.644 | 0.000 | ||
| 2 spectra, FSGSGSGTDFTLK | 0.000 | 0.428 | 0.000 | 0.000 | 0.000 | 0.300 | 0.271 | 0.000 |
| Plot | Mito | Lyso or Perox | ER | Golgi | PM | Cytosol | Nucleus | ||||||
| Expt B |
2 peptides |
2 spectra |
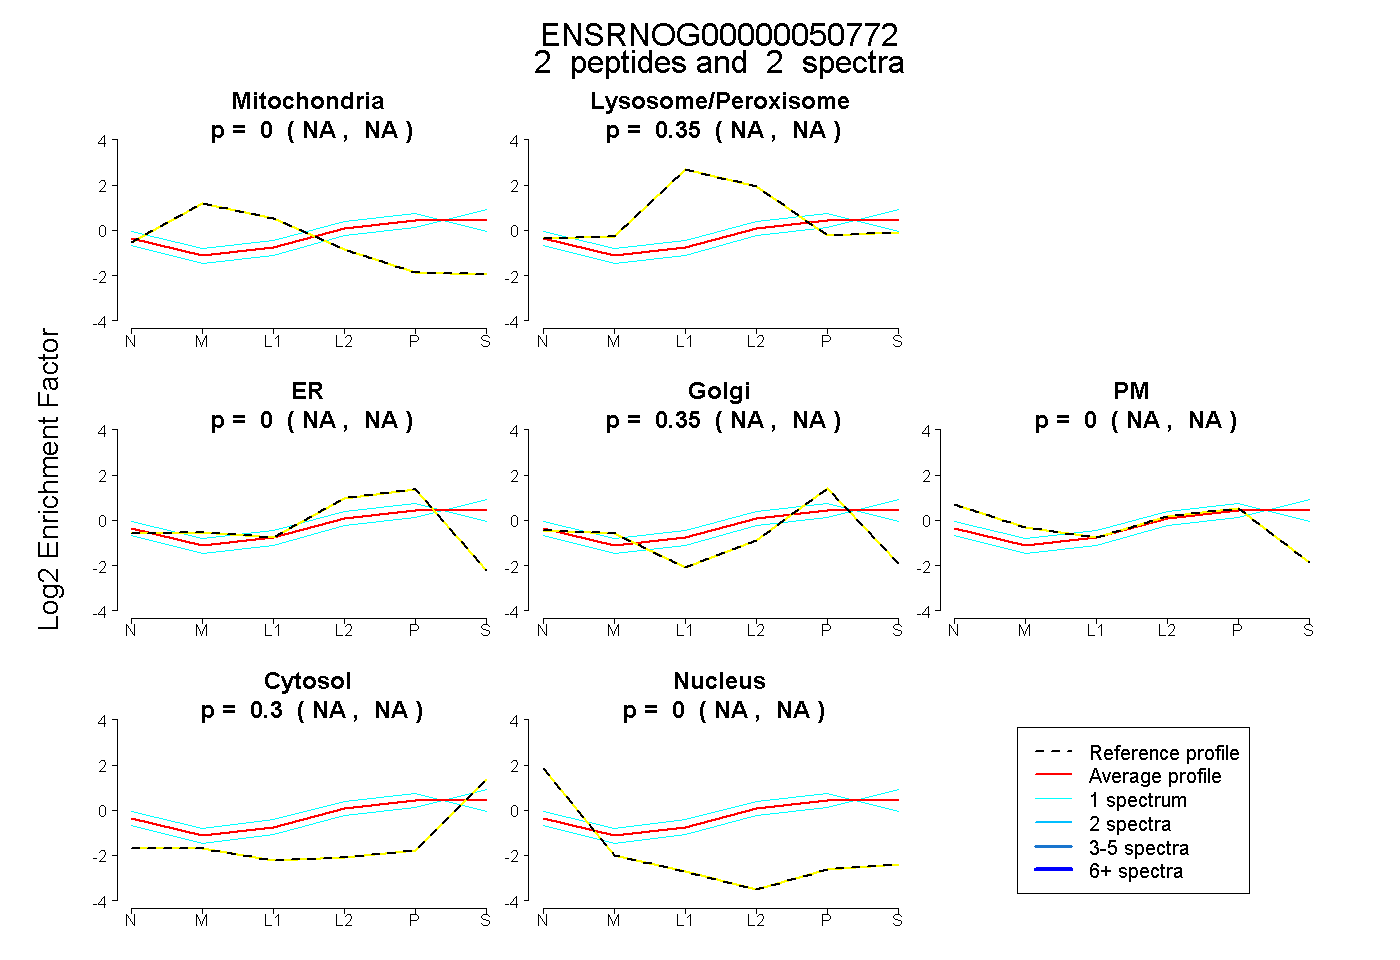 |
0.000 NA | NA |
0.346 NA | NA |
0.000 NA | NA |
0.350 NA | NA |
0.000 NA | NA |
0.304 NA | NA |
0.000 NA | NA |
|||
| Plot | Lyso | Other | |||||||||||
| Expt C |
2 peptides |
8 spectra |
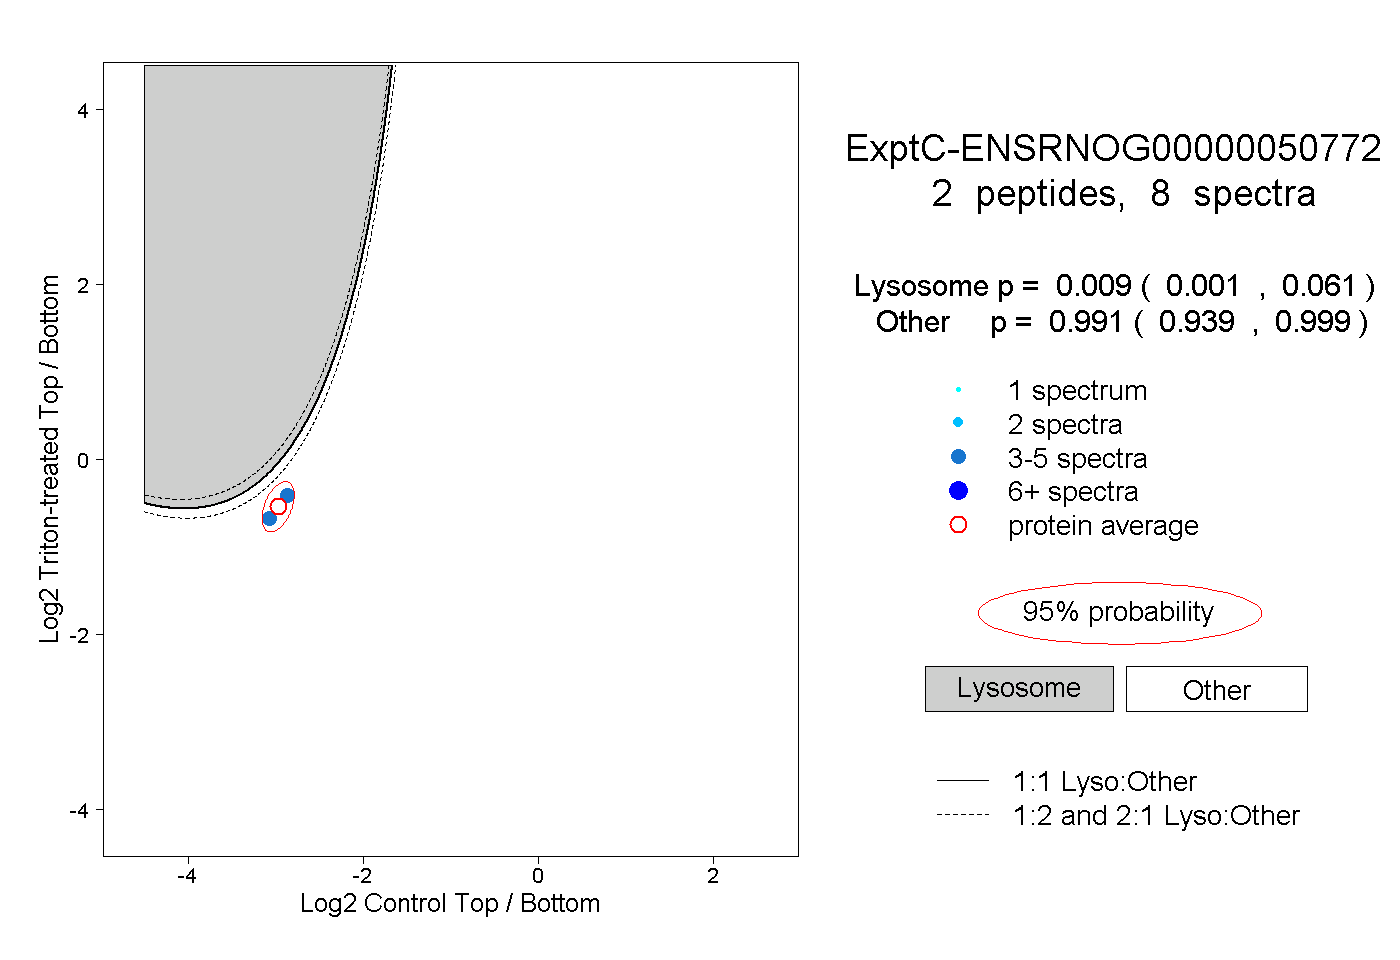 |
0.009 0.001 | 0.061 |
0.991 0.939 | 0.999 |