 11
11peptides
spectra
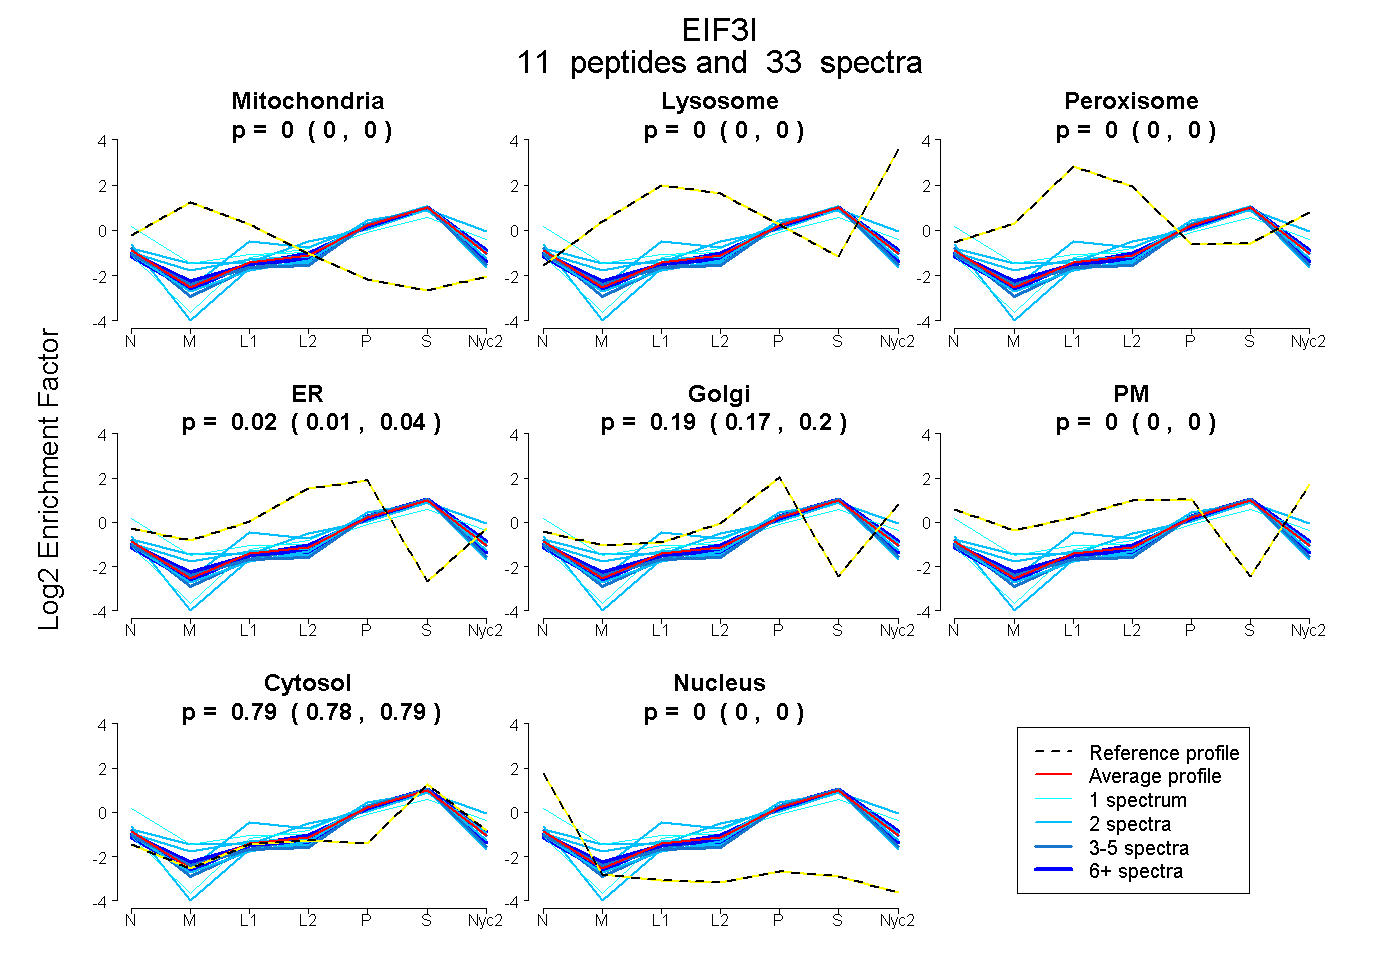
0.000 | 0.000
0.000 | 0.000
0.000 | 0.000
0.007 | 0.040
0.167 | 0.203
0.000 | 0.000
0.784 | 0.793
0.000 | 0.000
4peptides
spectra
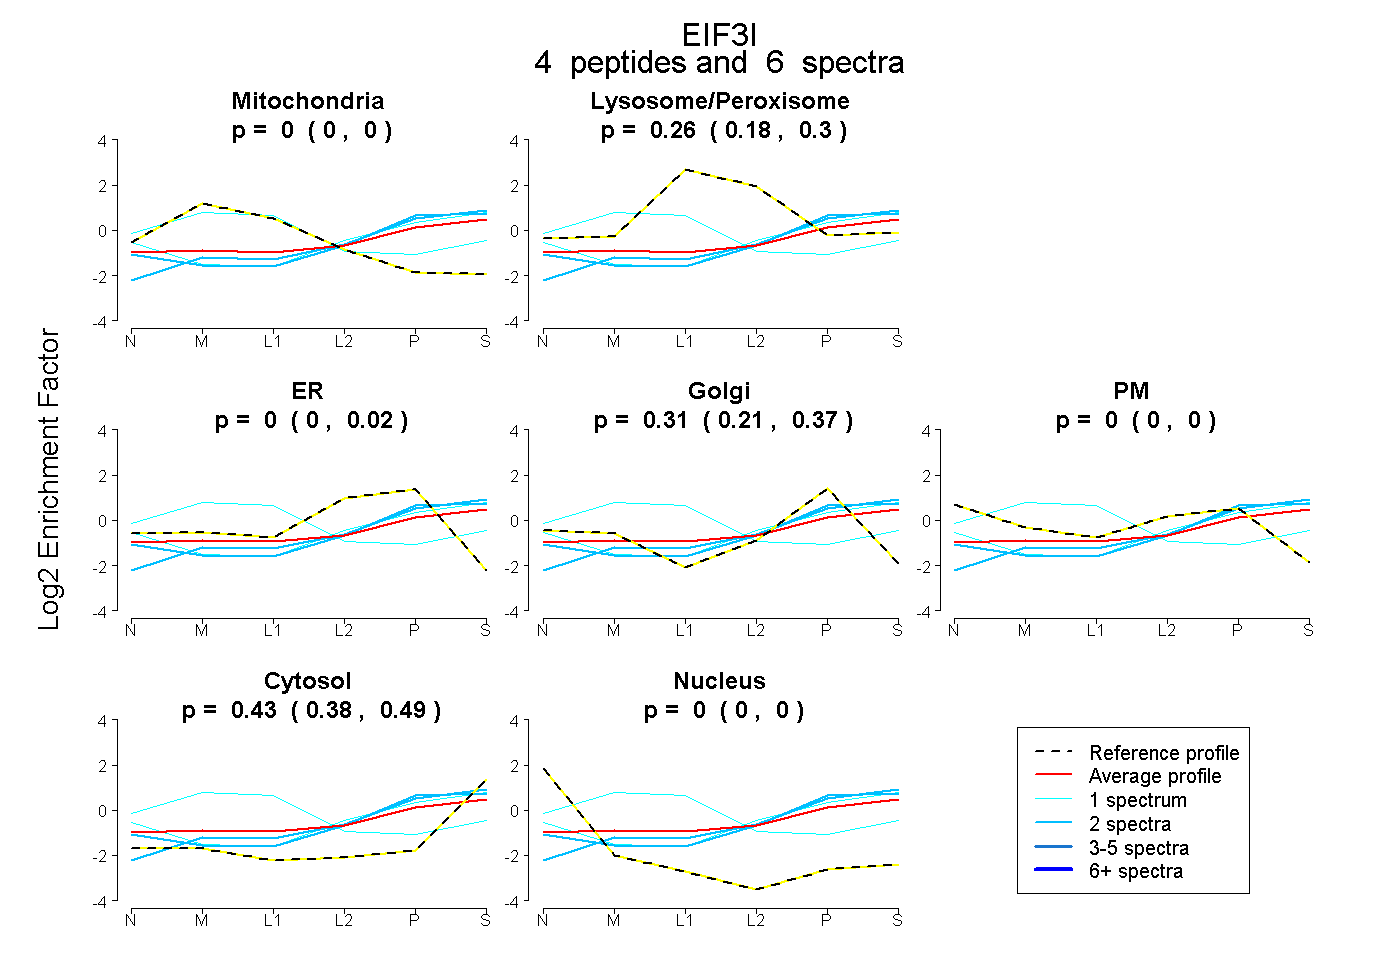
0.000 | 0.000
0.179 | 0.304
0.000 | 0.023
0.209 | 0.369
0.000 | 0.000
0.378 | 0.489
0.000 | 0.000
6peptides
spectra
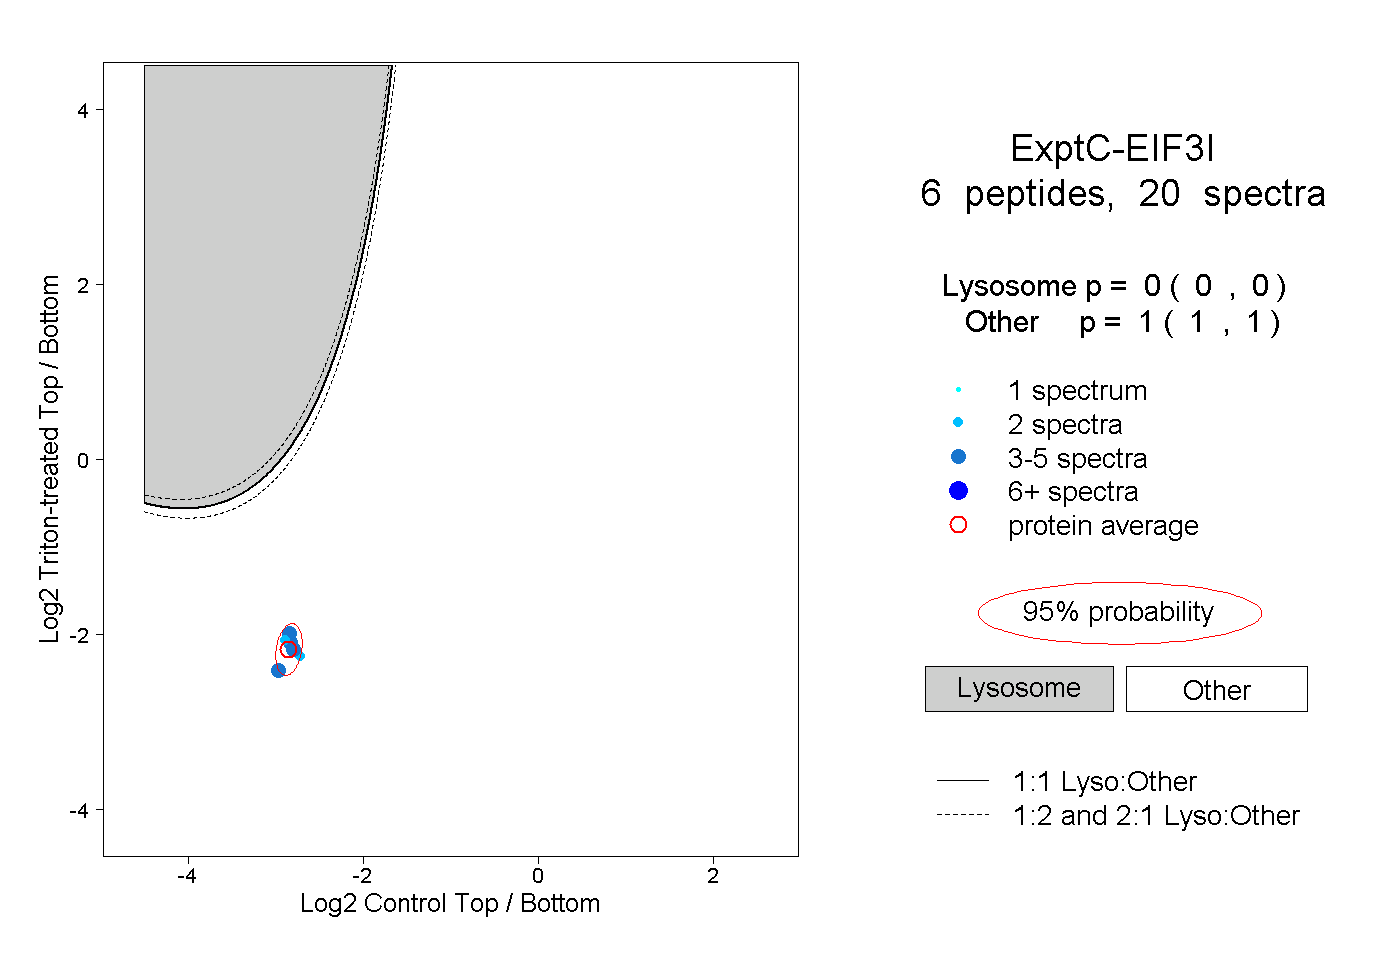
0.000 | 0.000
1.000 | 1.000
1peptide
spectrum
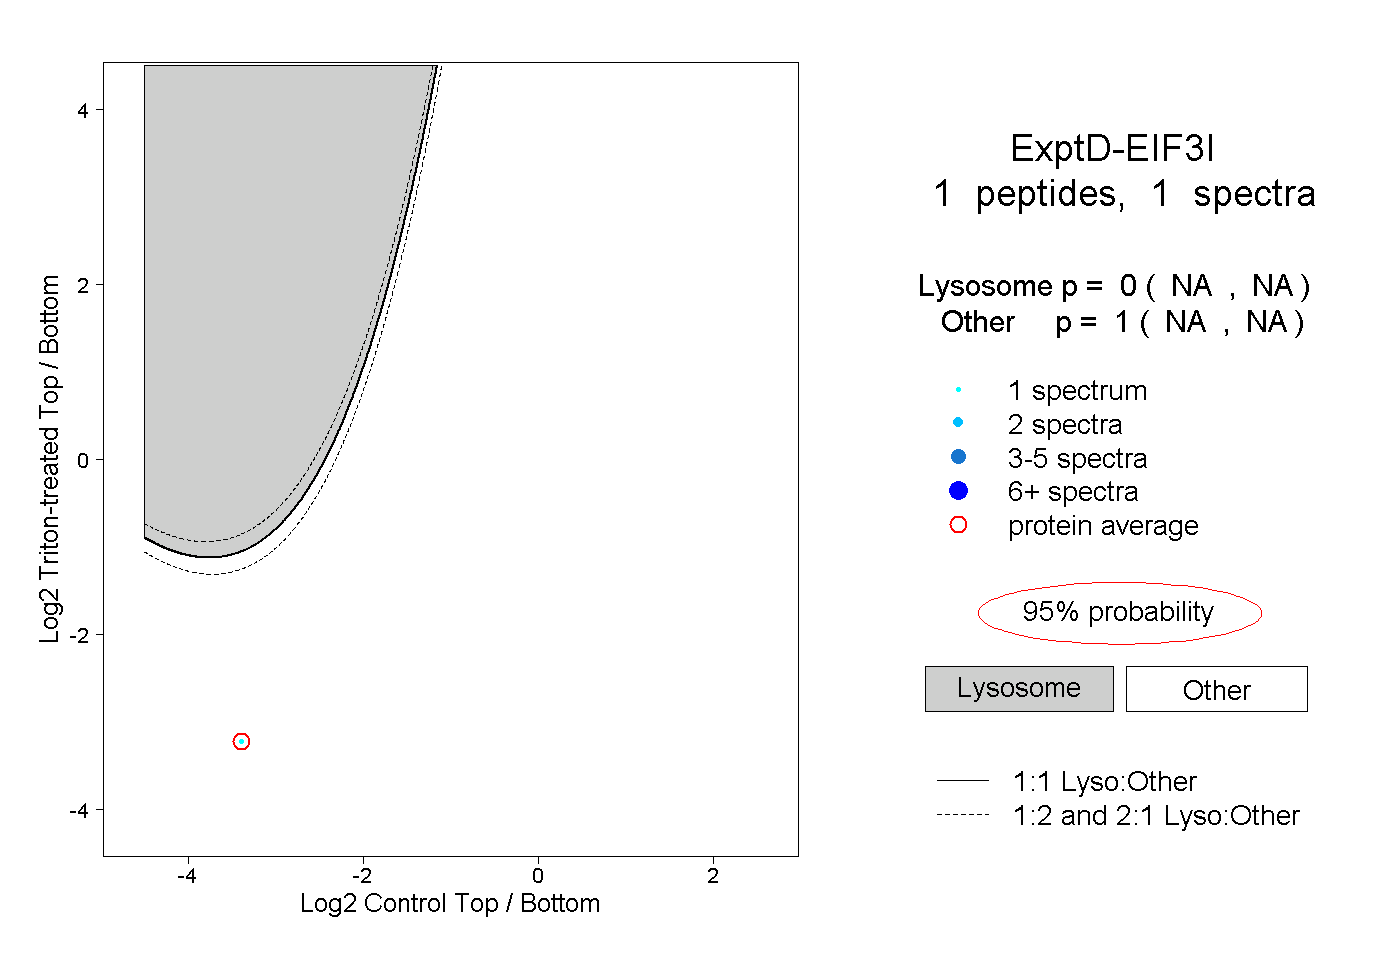
NA | NA
NA | NA