 29
29peptides
spectra
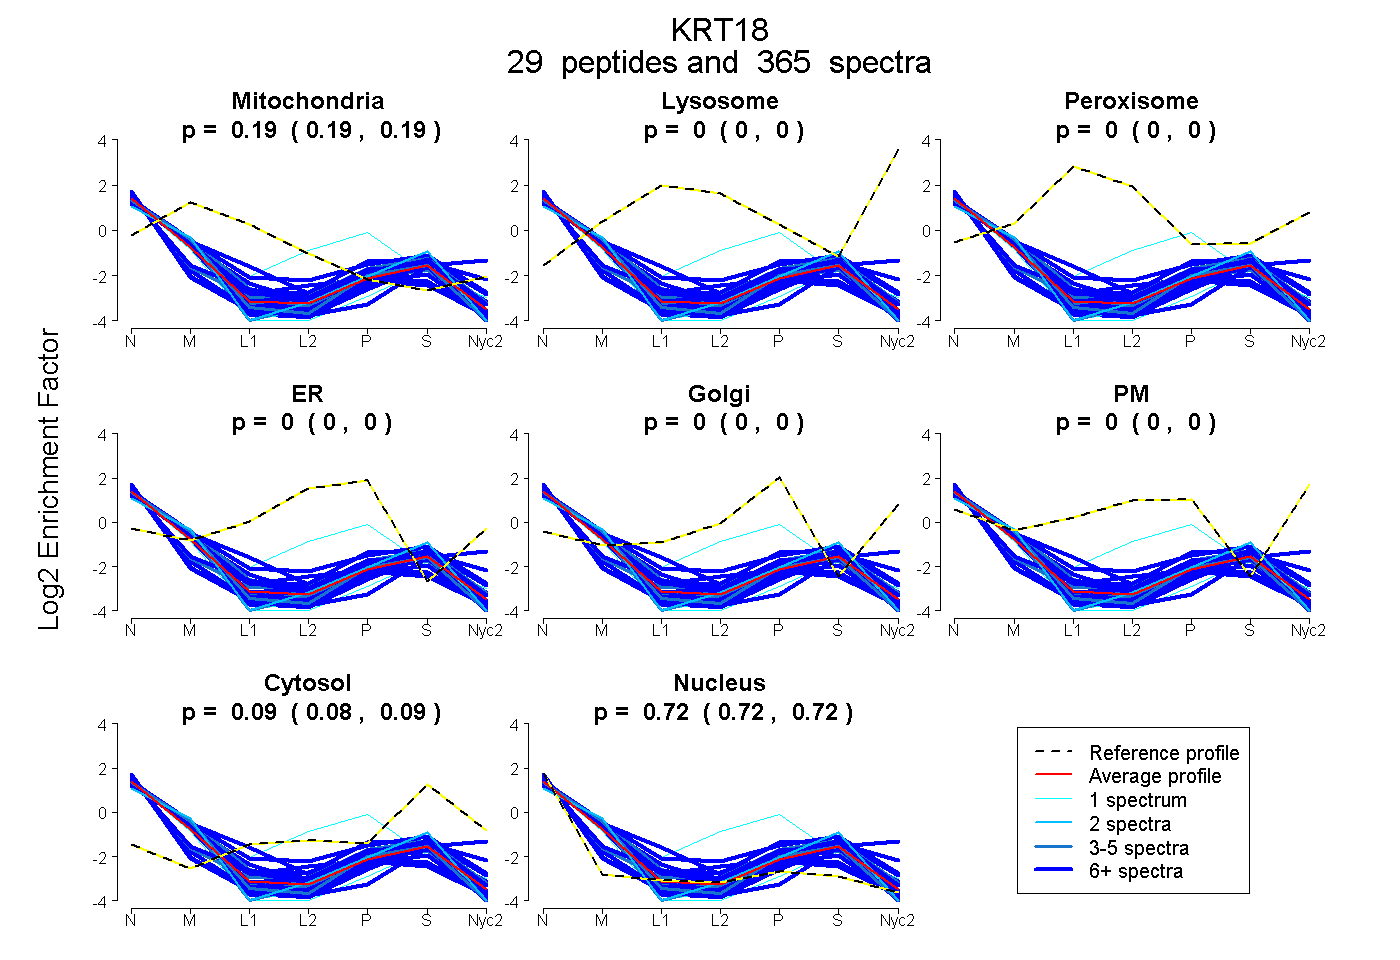
0.189 | 0.193
0.000 | 0.000
0.000 | 0.000
0.000 | 0.000
0.000 | 0.000
0.000 | 0.000
0.085 | 0.088
0.721 | 0.724
22peptides
spectra
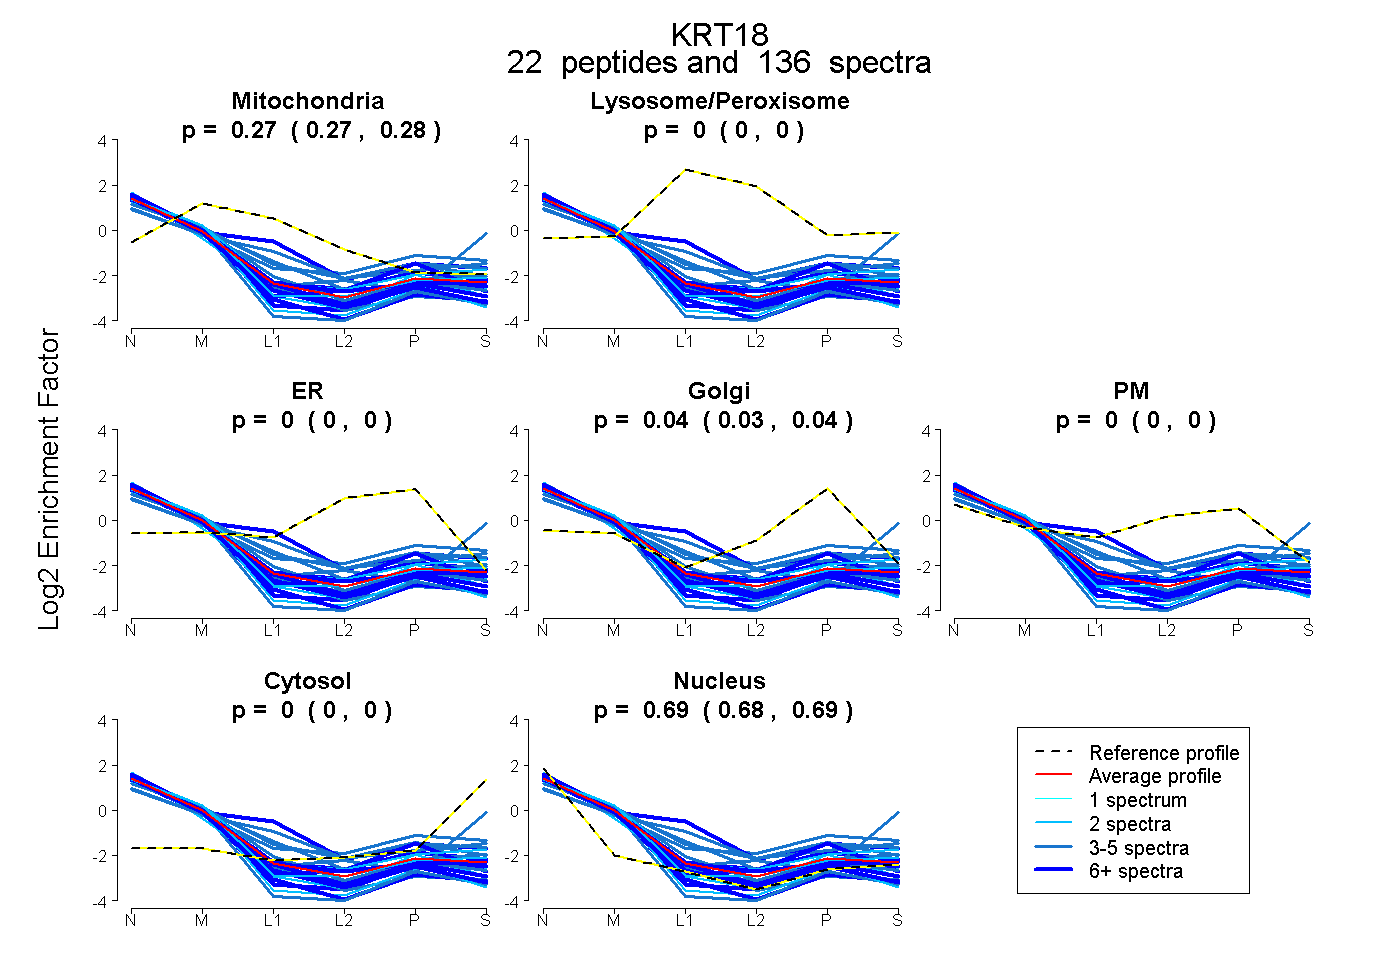
0.268 | 0.278
0.000 | 0.000
0.000 | 0.000
0.035 | 0.045
0.000 | 0.000
0.000 | 0.000
0.682 | 0.689
19peptides
spectra
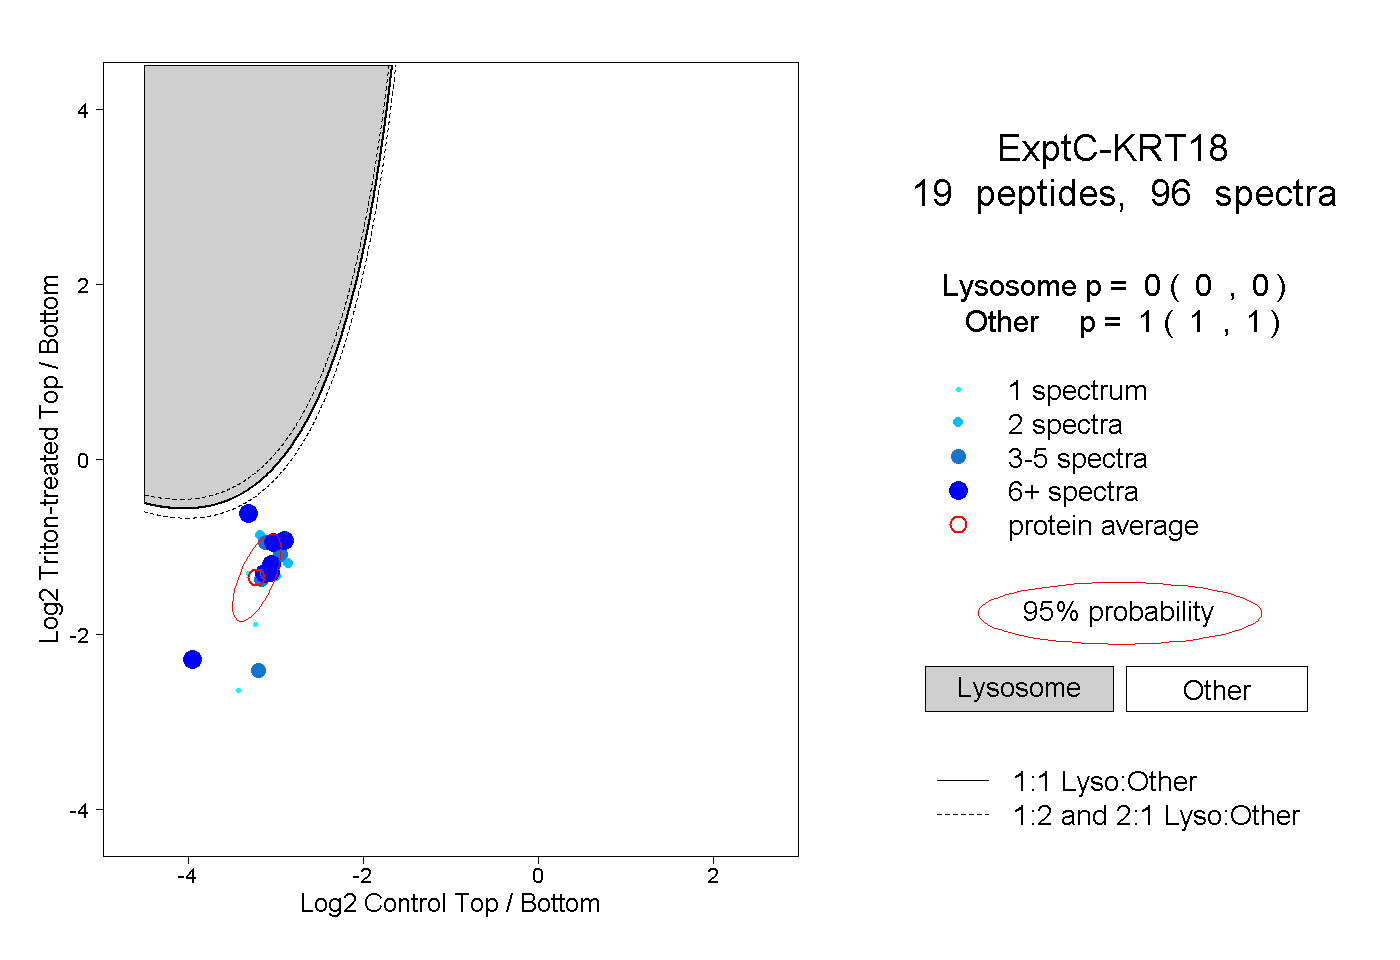
0.000 | 0.000
1.000 | 1.000
7peptides
spectra
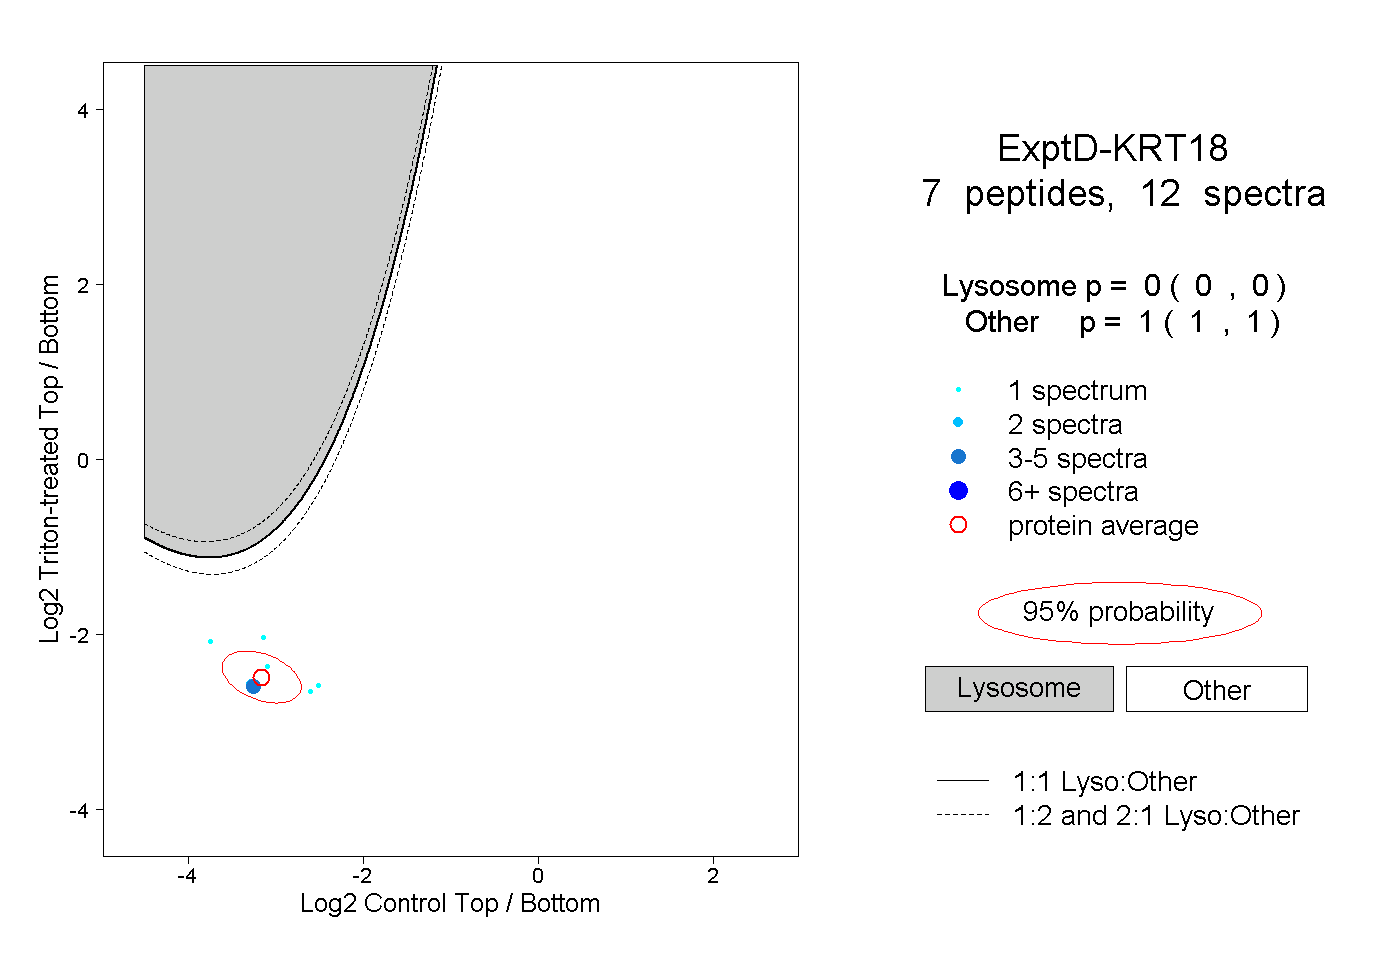
0.000 | 0.000
1.000 | 1.000