 29
29peptides
spectra
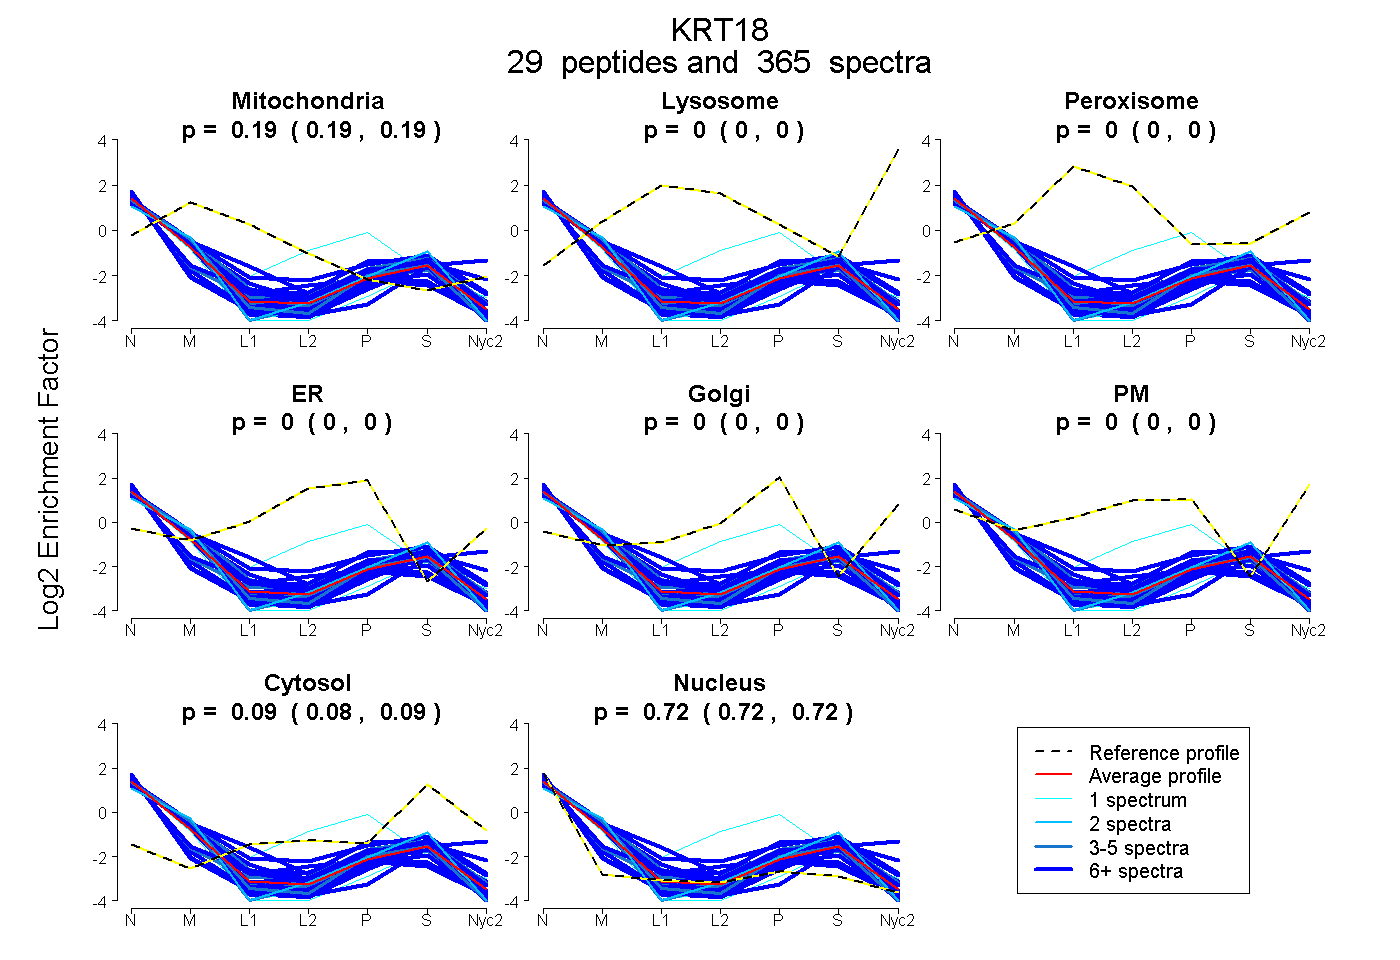
0.189 | 0.193
0.000 | 0.000
0.000 | 0.000
0.000 | 0.000
0.000 | 0.000
0.000 | 0.000
0.085 | 0.088
0.721 | 0.724
| Plot | Mito | Lyso | Perox | ER | Golgi | PM | Cytosol | Nucleus | |||||
| Expt A |
29 peptides |
365 spectra |
|
0.191 0.189 | 0.193 |
0.000 0.000 | 0.000 |
0.000 0.000 | 0.000 |
0.000 0.000 | 0.000 |
0.000 0.000 | 0.000 |
0.000 0.000 | 0.000 |
0.086 0.085 | 0.088 |
0.722 0.721 | 0.724 |
| 5 spectra, SVWGGSVGSAGLAGMGGVQTEK | 0.062 | 0.000 | 0.000 | 0.000 | 0.012 | 0.000 | 0.213 | 0.712 | ||
| 33 spectra, TIEDLR | 0.233 | 0.000 | 0.000 | 0.000 | 0.000 | 0.000 | 0.111 | 0.656 | ||
| 4 spectra, NQNINLENNLGEVEAR | 0.163 | 0.000 | 0.000 | 0.000 | 0.000 | 0.000 | 0.020 | 0.816 | ||
| 1 spectrum, LQLETEIEALK | 0.052 | 0.000 | 0.000 | 0.000 | 0.000 | 0.000 | 0.124 | 0.824 | ||
| 19 spectra, LAADDFR | 0.265 | 0.000 | 0.000 | 0.000 | 0.003 | 0.008 | 0.174 | 0.550 | ||
| 9 spectra, QSVESDIHGLR | 0.328 | 0.000 | 0.000 | 0.000 | 0.025 | 0.000 | 0.204 | 0.443 | ||
| 4 spectra, EELLFMK | 0.215 | 0.000 | 0.000 | 0.000 | 0.000 | 0.000 | 0.059 | 0.726 | ||
| 10 spectra, EYLEK | 0.141 | 0.000 | 0.000 | 0.000 | 0.000 | 0.000 | 0.025 | 0.834 | ||
| 31 spectra, STTFSTNYR | 0.055 | 0.000 | 0.000 | 0.000 | 0.000 | 0.000 | 0.000 | 0.945 | ||
| 32 spectra, DAETTLLELR | 0.155 | 0.000 | 0.000 | 0.000 | 0.000 | 0.000 | 0.030 | 0.816 | ||
| 14 spectra, AQYEQLAQK | 0.193 | 0.000 | 0.000 | 0.000 | 0.000 | 0.000 | 0.070 | 0.736 | ||
| 8 spectra, NLETENR | 0.229 | 0.000 | 0.000 | 0.000 | 0.029 | 0.000 | 0.144 | 0.598 | ||
| 27 spectra, IVLQIDNAR | 0.165 | 0.000 | 0.000 | 0.000 | 0.000 | 0.000 | 0.026 | 0.809 | ||
| 14 spectra, IMADIR | 0.220 | 0.000 | 0.000 | 0.000 | 0.000 | 0.000 | 0.070 | 0.709 | ||
| 10 spectra, VVDDTNITR | 0.220 | 0.000 | 0.000 | 0.000 | 0.000 | 0.000 | 0.060 | 0.721 | ||
| 14 spectra, VRPASSAASVYAGAGGSGSR | 0.000 | 0.000 | 0.000 | 0.000 | 0.000 | 0.000 | 0.069 | 0.931 | ||
| 5 spectra, LEAEIATYR | 0.283 | 0.000 | 0.000 | 0.000 | 0.000 | 0.000 | 0.058 | 0.658 | ||
| 13 spectra, SLGSVR | 0.000 | 0.000 | 0.000 | 0.000 | 0.000 | 0.000 | 0.031 | 0.969 | ||
| 2 spectra, YWSQQIEESTTVVTTK | 0.137 | 0.000 | 0.000 | 0.000 | 0.000 | 0.000 | 0.141 | 0.722 | ||
| 1 spectrum, IVLEIDNAR | 0.134 | 0.000 | 0.000 | 0.389 | 0.000 | 0.000 | 0.000 | 0.477 | ||
| 4 spectra, YETELAMR | 0.199 | 0.000 | 0.000 | 0.000 | 0.000 | 0.000 | 0.026 | 0.775 | ||
| 21 spectra, VVSETNDTR | 0.115 | 0.000 | 0.000 | 0.000 | 0.000 | 0.000 | 0.189 | 0.697 | ||
| 1 spectrum, GPQGVR | 0.129 | 0.000 | 0.000 | 0.000 | 0.000 | 0.000 | 0.000 | 0.871 | ||
| 7 spectra, QTQEYEALLNIK | 0.249 | 0.000 | 0.000 | 0.000 | 0.000 | 0.000 | 0.172 | 0.579 | ||
| 6 spectra, TLQTLEIDLDSMK | 0.175 | 0.000 | 0.000 | 0.000 | 0.000 | 0.000 | 0.000 | 0.825 | ||
| 19 spectra, LASYLDK | 0.266 | 0.067 | 0.000 | 0.000 | 0.000 | 0.077 | 0.113 | 0.478 | ||
| 8 spectra, SQDLSK | 0.287 | 0.000 | 0.000 | 0.000 | 0.000 | 0.000 | 0.092 | 0.622 | ||
| 24 spectra, AQIFANSVDNAR | 0.147 | 0.000 | 0.000 | 0.000 | 0.000 | 0.000 | 0.025 | 0.828 | ||
| 19 spectra, DWGHYFK | 0.207 | 0.000 | 0.000 | 0.000 | 0.000 | 0.000 | 0.077 | 0.716 |
| Plot | Mito | Lyso or Perox | ER | Golgi | PM | Cytosol | Nucleus | ||||||
| Expt B |
22 peptides |
136 spectra |
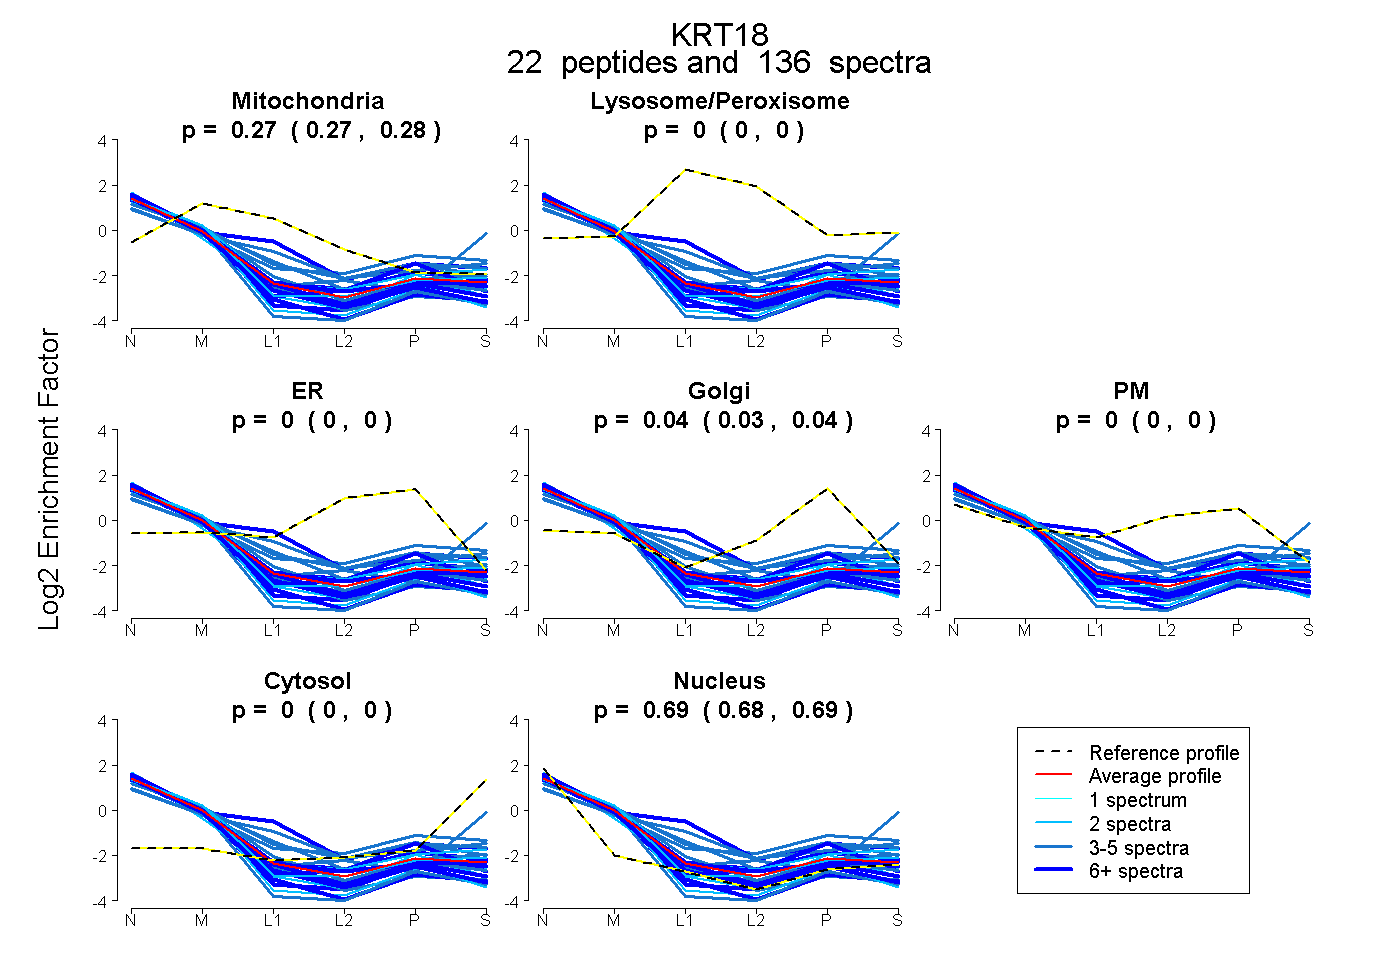 |
0.274 0.268 | 0.278 |
0.000 0.000 | 0.000 |
0.000 0.000 | 0.000 |
0.040 0.035 | 0.045 |
0.000 0.000 | 0.000 |
0.000 0.000 | 0.000 |
0.686 0.682 | 0.689 |
|||
| Plot | Lyso | Other | |||||||||||
| Expt C |
19 peptides |
96 spectra |
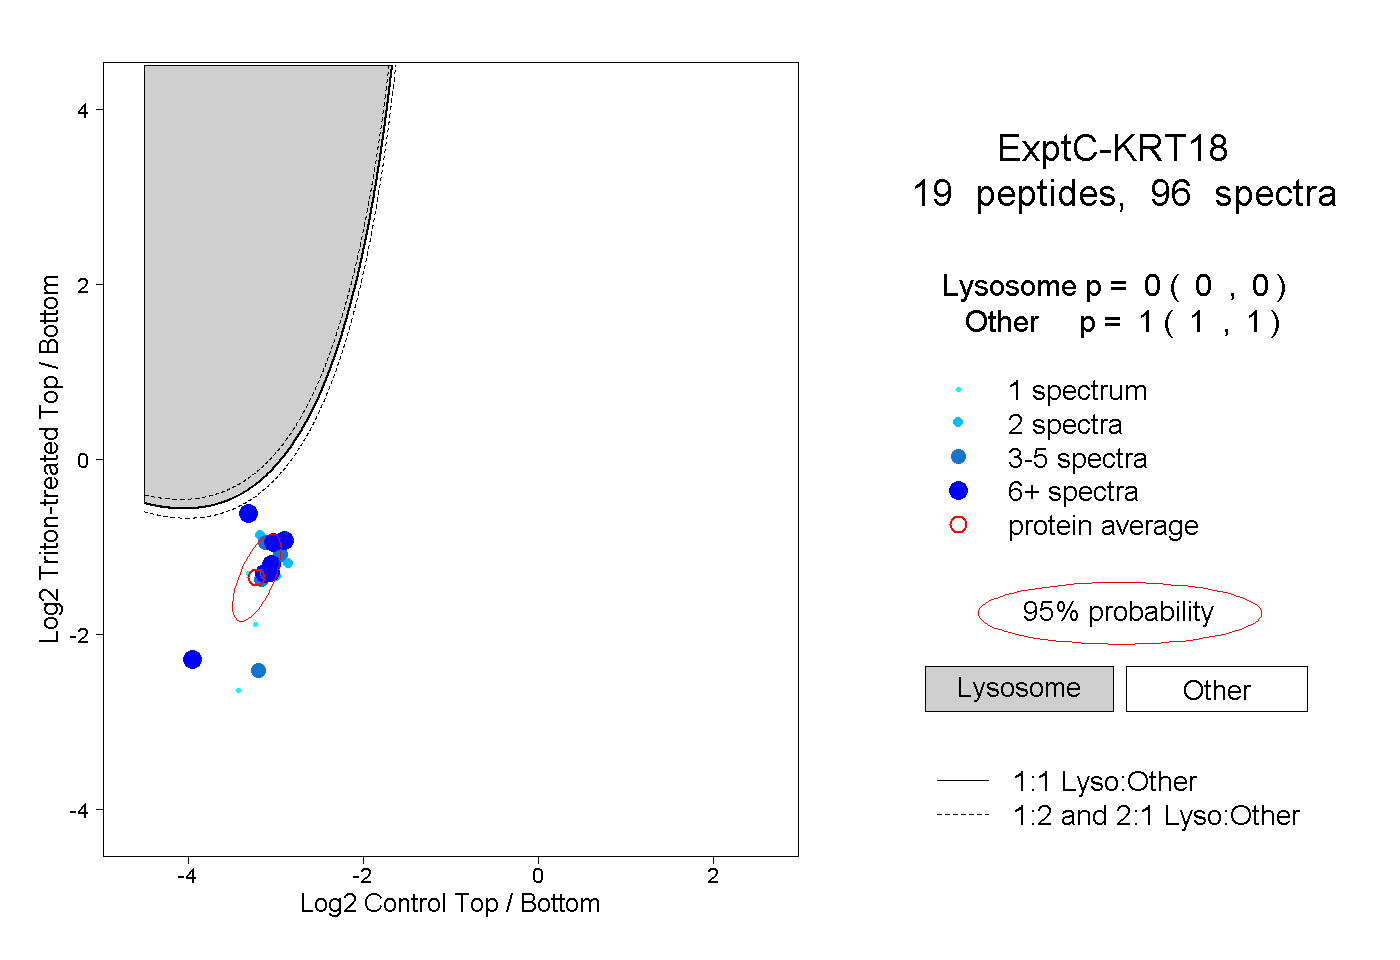 |
0.000 0.000 | 0.000 |
1.000 1.000 | 1.000 |
||||||||
| Plot | Lyso | Other | |||||||||||
| Expt D |
7 peptides |
12 spectra |
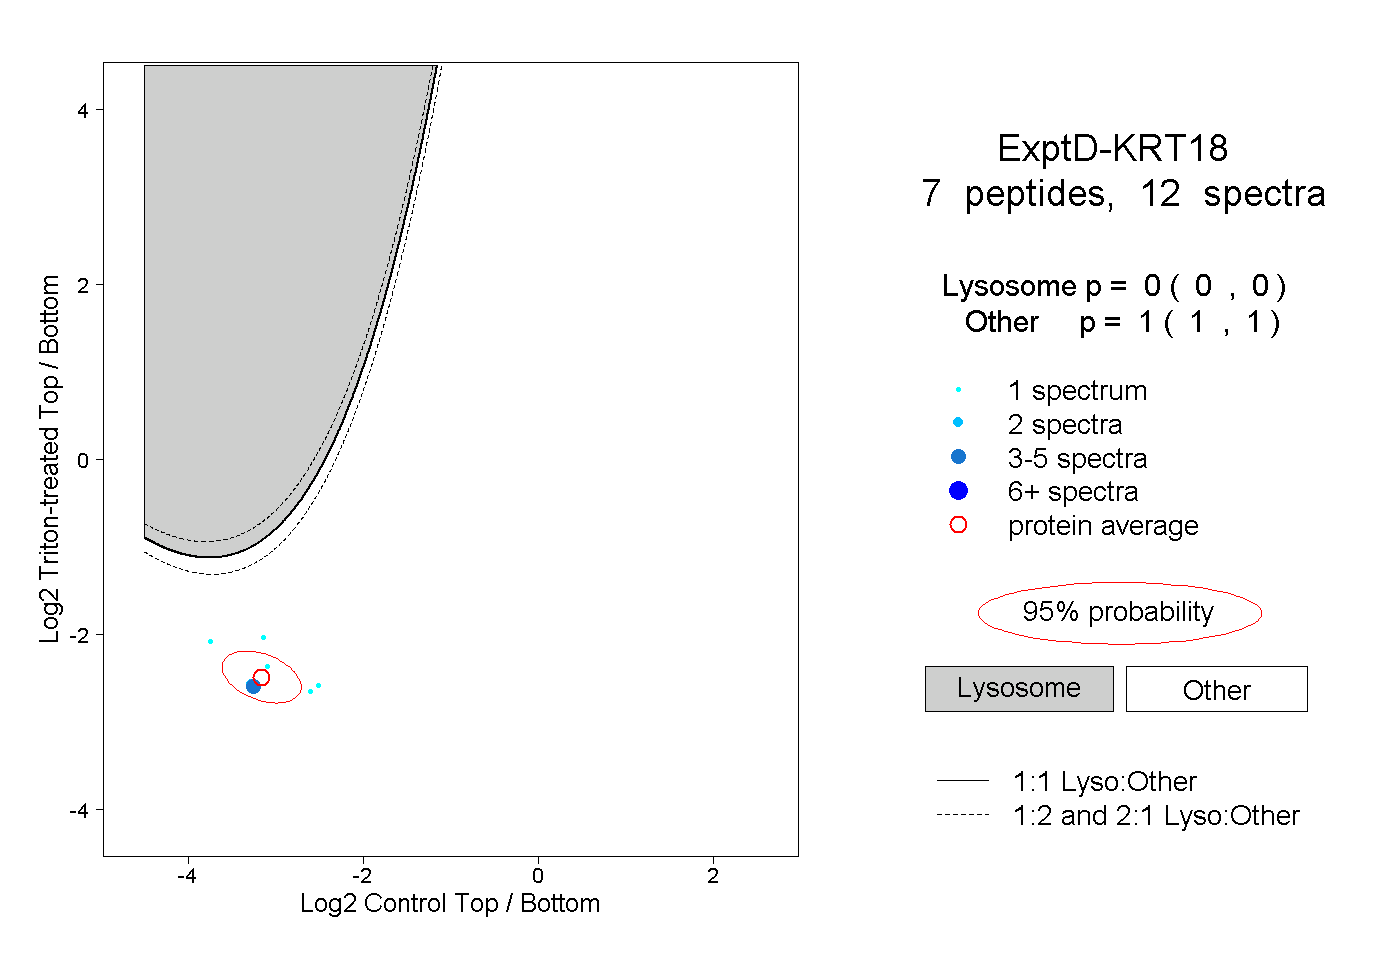 |
0.000 0.000 | 0.000 |
1.000 1.000 | 1.000 |