 3
3peptides
spectra
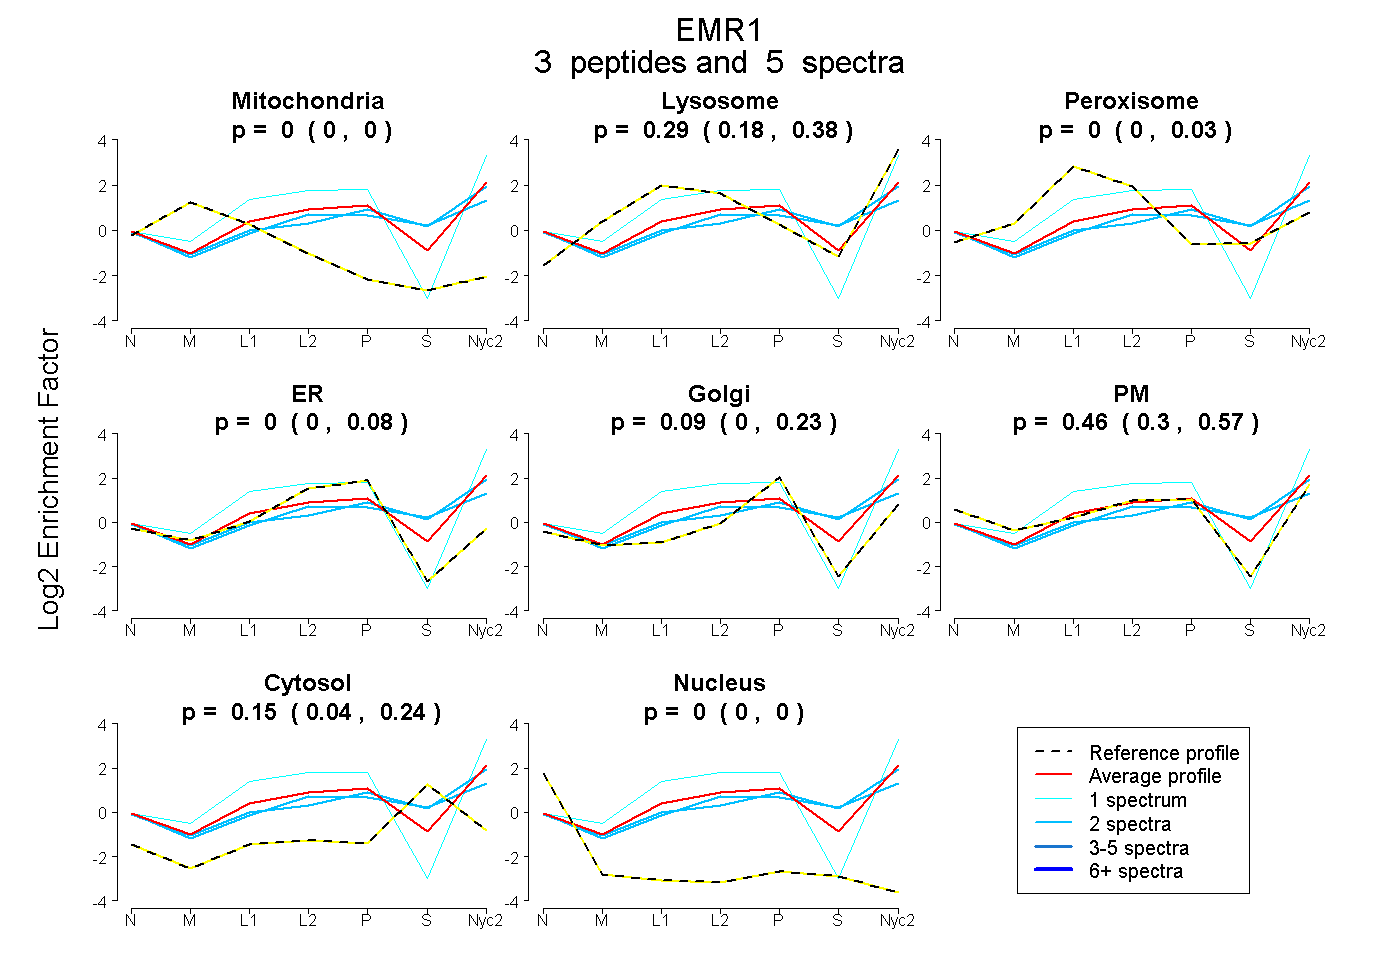
0.000 | 0.000
0.179 | 0.380
0.000 | 0.035
0.000 | 0.077
0.000 | 0.230
0.300 | 0.565
0.045 | 0.235
0.000 | 0.000
6peptides
spectra
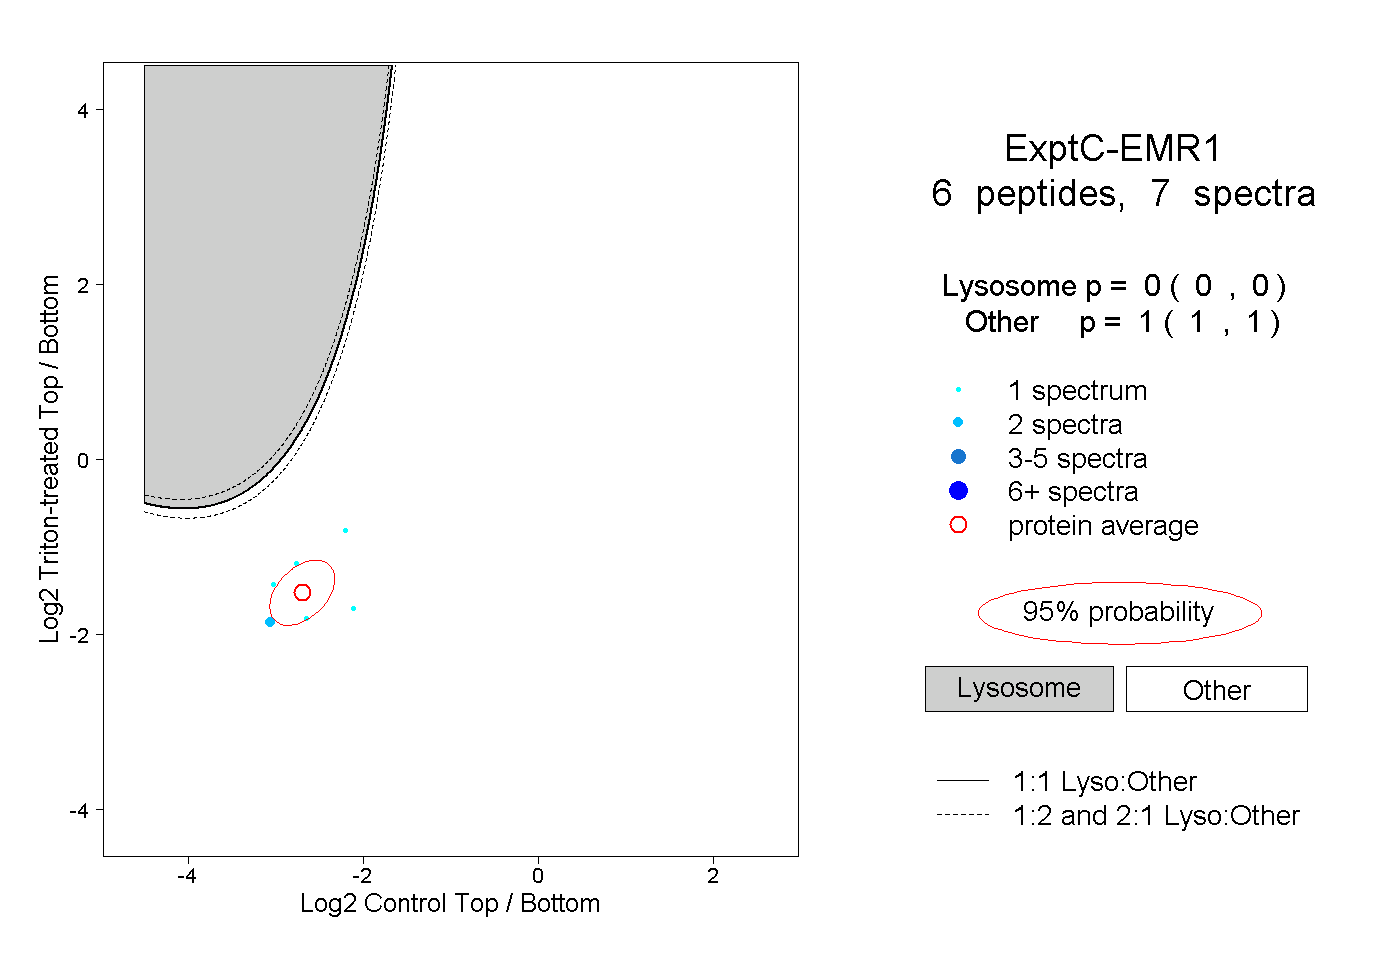
0.000 | 0.000
1.000 | 1.000
1peptide
spectra
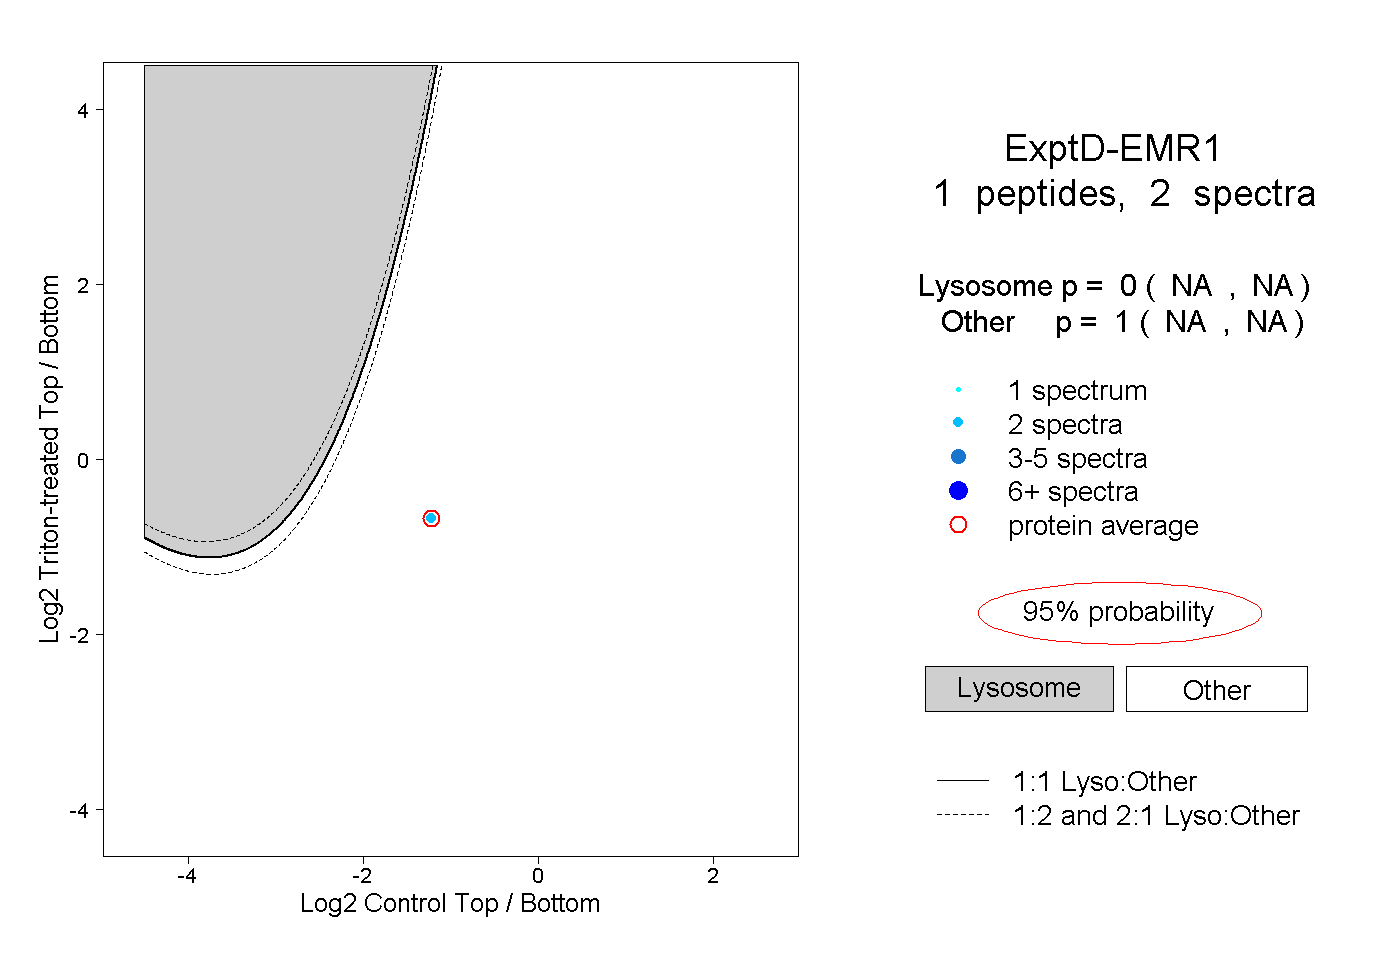
NA | NA
NA | NA