 3
3peptides
spectra
0.000 | 0.000
0.179 | 0.380
0.000 | 0.035
0.000 | 0.077
0.000 | 0.230
0.300 | 0.565
0.045 | 0.235
0.000 | 0.000
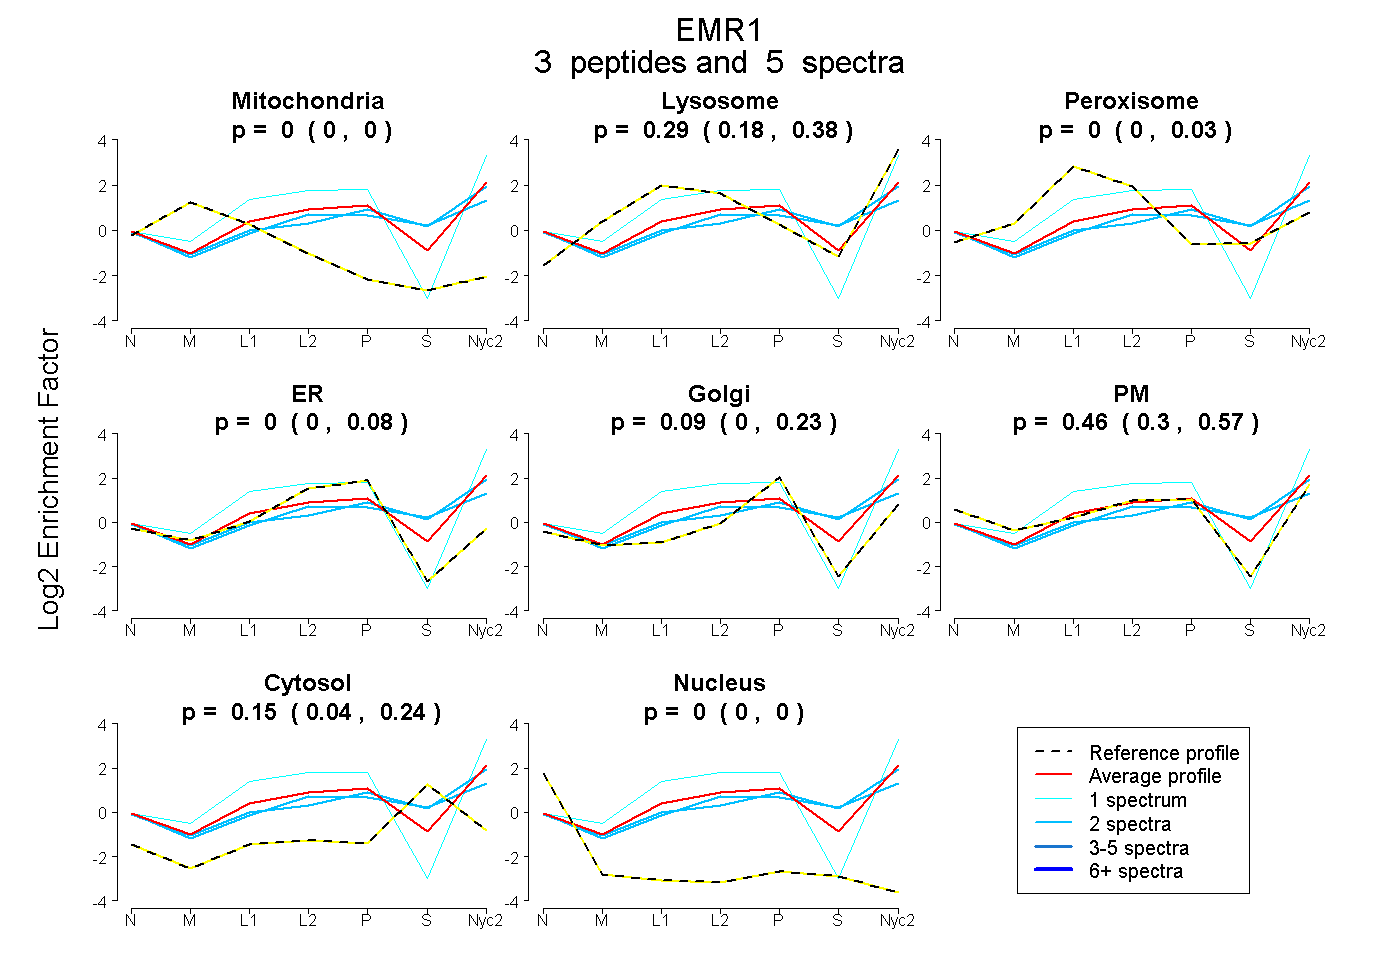
| Plot | Mito | Lyso | Perox | ER | Golgi | PM | Cytosol | Nucleus | |||||
| Expt A |
3 peptides |
5 spectra |
|
0.000 0.000 | 0.000 |
0.293 0.179 | 0.380 |
0.000 0.000 | 0.035 |
0.000 0.000 | 0.077 |
0.090 0.000 | 0.230 |
0.464 0.300 | 0.565 |
0.153 0.045 | 0.235 |
0.000 0.000 | 0.000 |
| 1 spectrum, ILFLTGIDK | 0.000 | 0.377 | 0.000 | 0.000 | 0.000 | 0.623 | 0.000 | 0.000 | ||
| 2 spectra, TEYLEIESK | 0.000 | 0.286 | 0.000 | 0.000 | 0.068 | 0.327 | 0.320 | 0.000 | ||
| 2 spectra, SEQIEQCQAGQGR | 0.000 | 0.199 | 0.009 | 0.000 | 0.000 | 0.420 | 0.372 | 0.000 |
| Plot | Lyso | Other | |||||||||||
| Expt C |
6 peptides |
7 spectra |
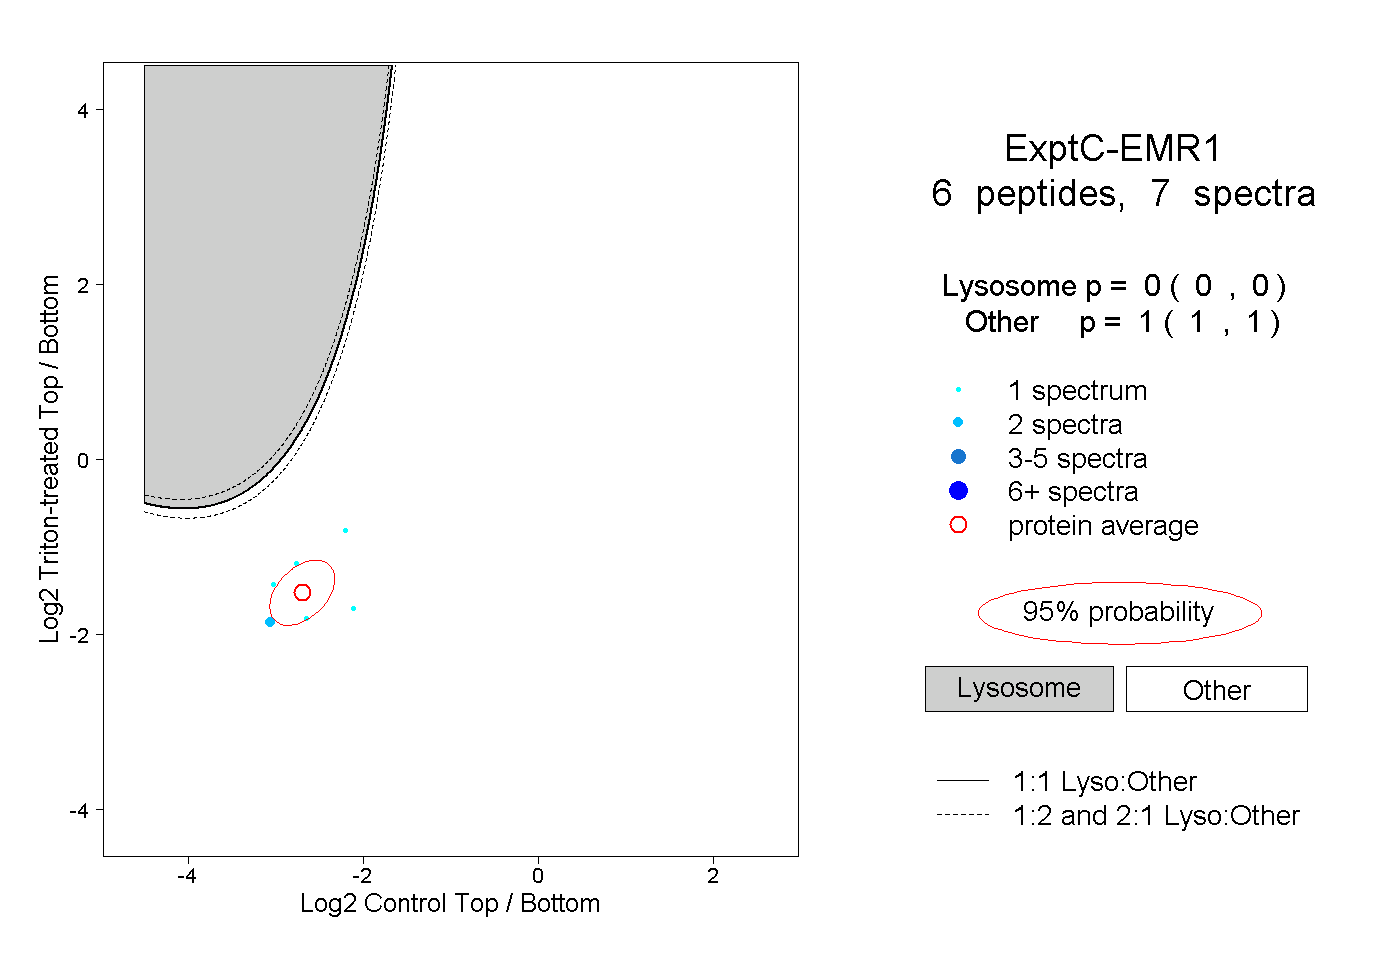 |
0.000 0.000 | 0.000 |
1.000 1.000 | 1.000 |
||||||||
| Plot | Lyso | Other | |||||||||||
| Expt D |
1 peptide |
2 spectra |
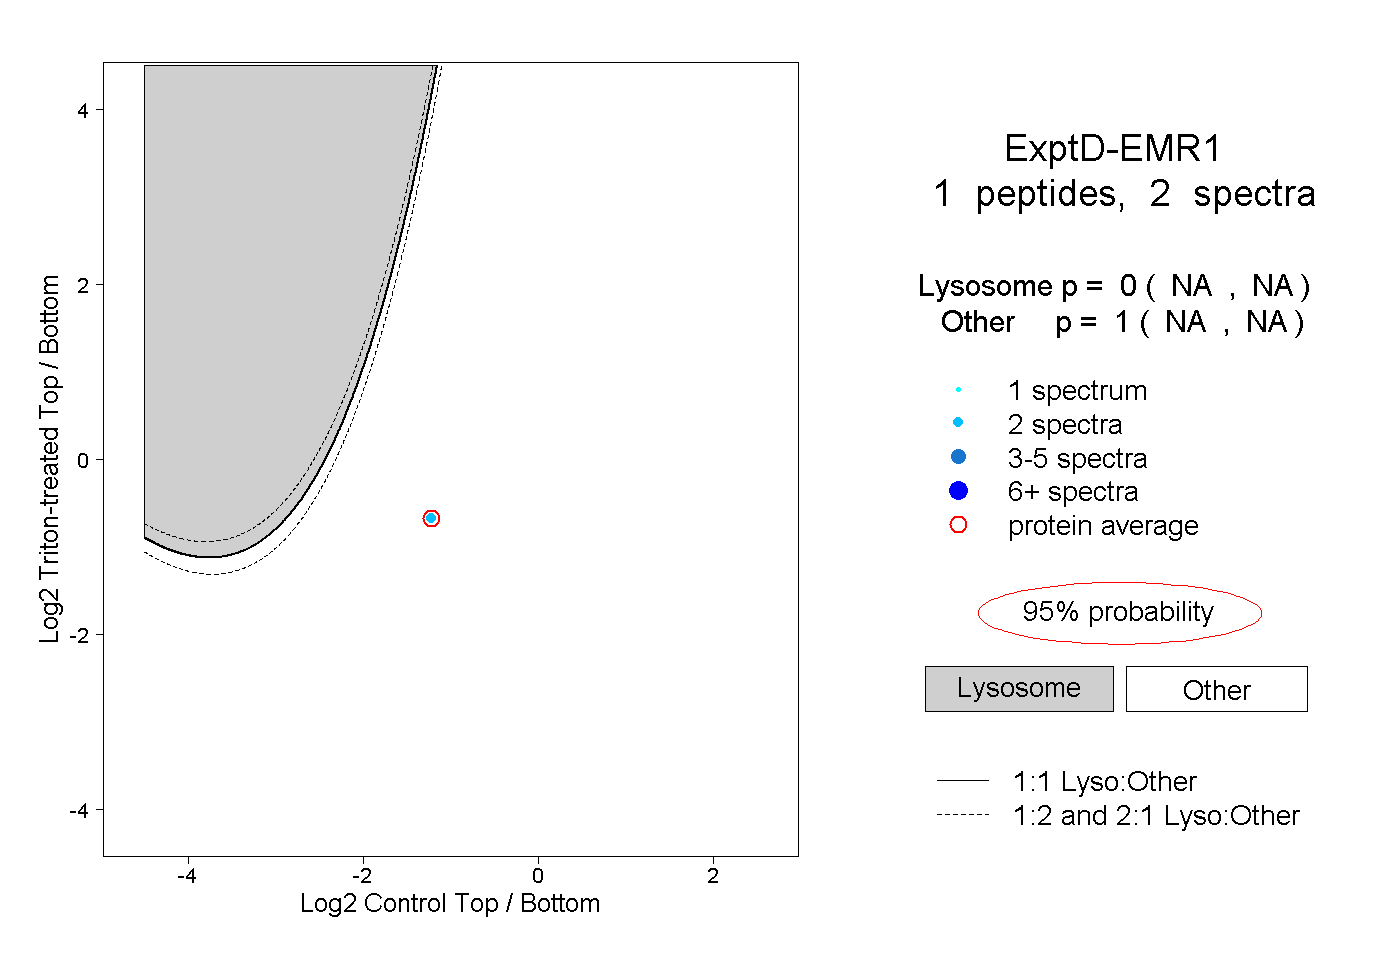 |
0.000 NA | NA |
1.000 NA | NA |