 5
5peptides
spectra
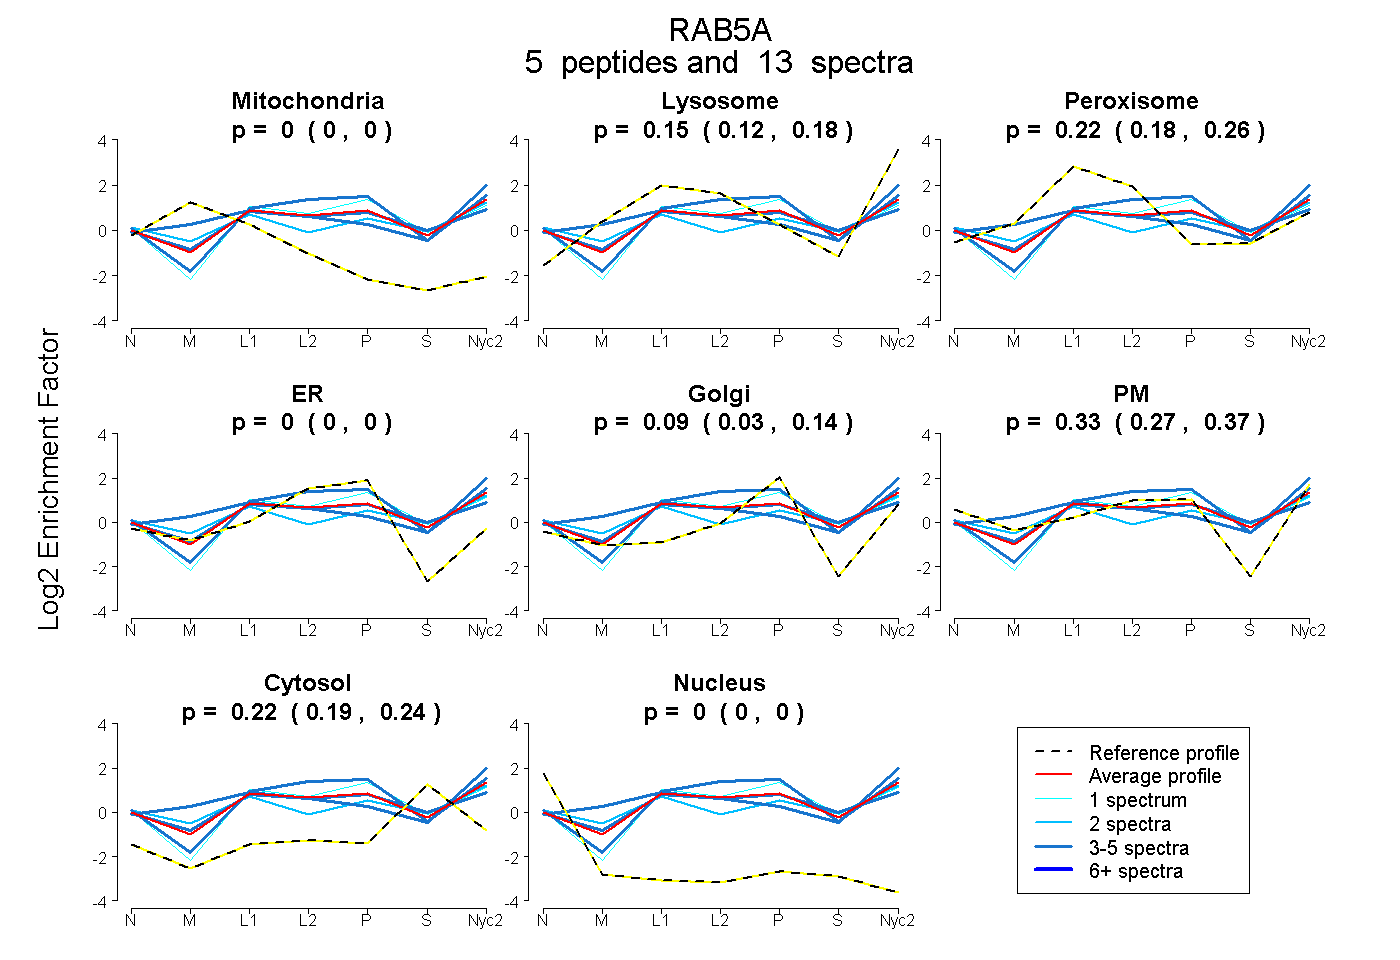
0.000 | 0.000
0.117 | 0.179
0.175 | 0.255
0.000 | 0.000
0.026 | 0.142
0.266 | 0.374
0.193 | 0.241
0.000 | 0.000
3peptides
spectra
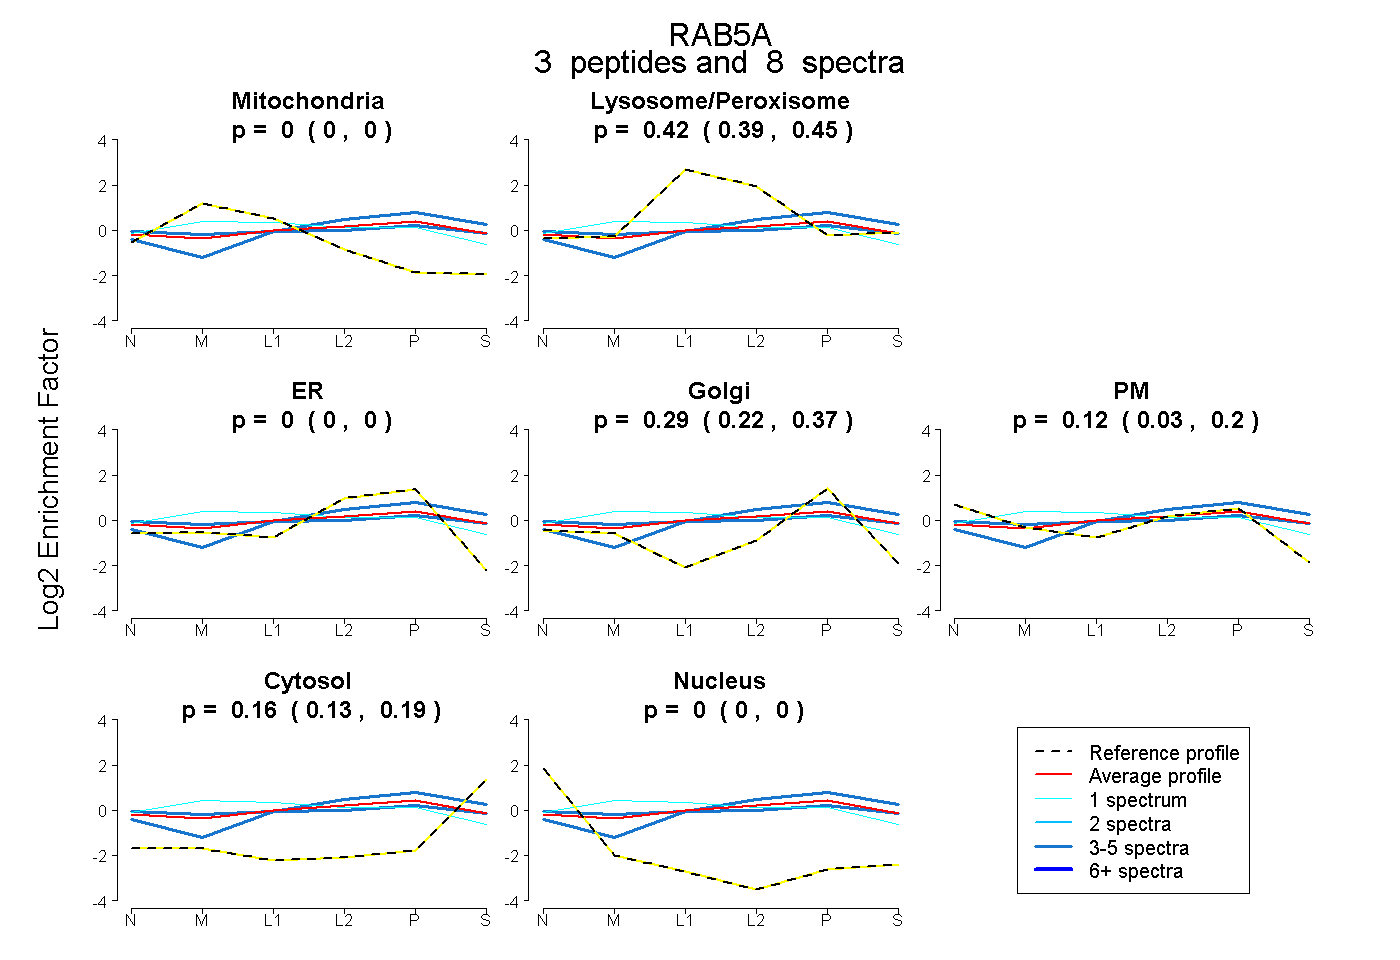
0.000 | 0.000
0.388 | 0.446
0.000 | 0.000
0.215 | 0.368
0.032 | 0.200
0.127 | 0.193
0.000 | 0.000
8peptides
spectra
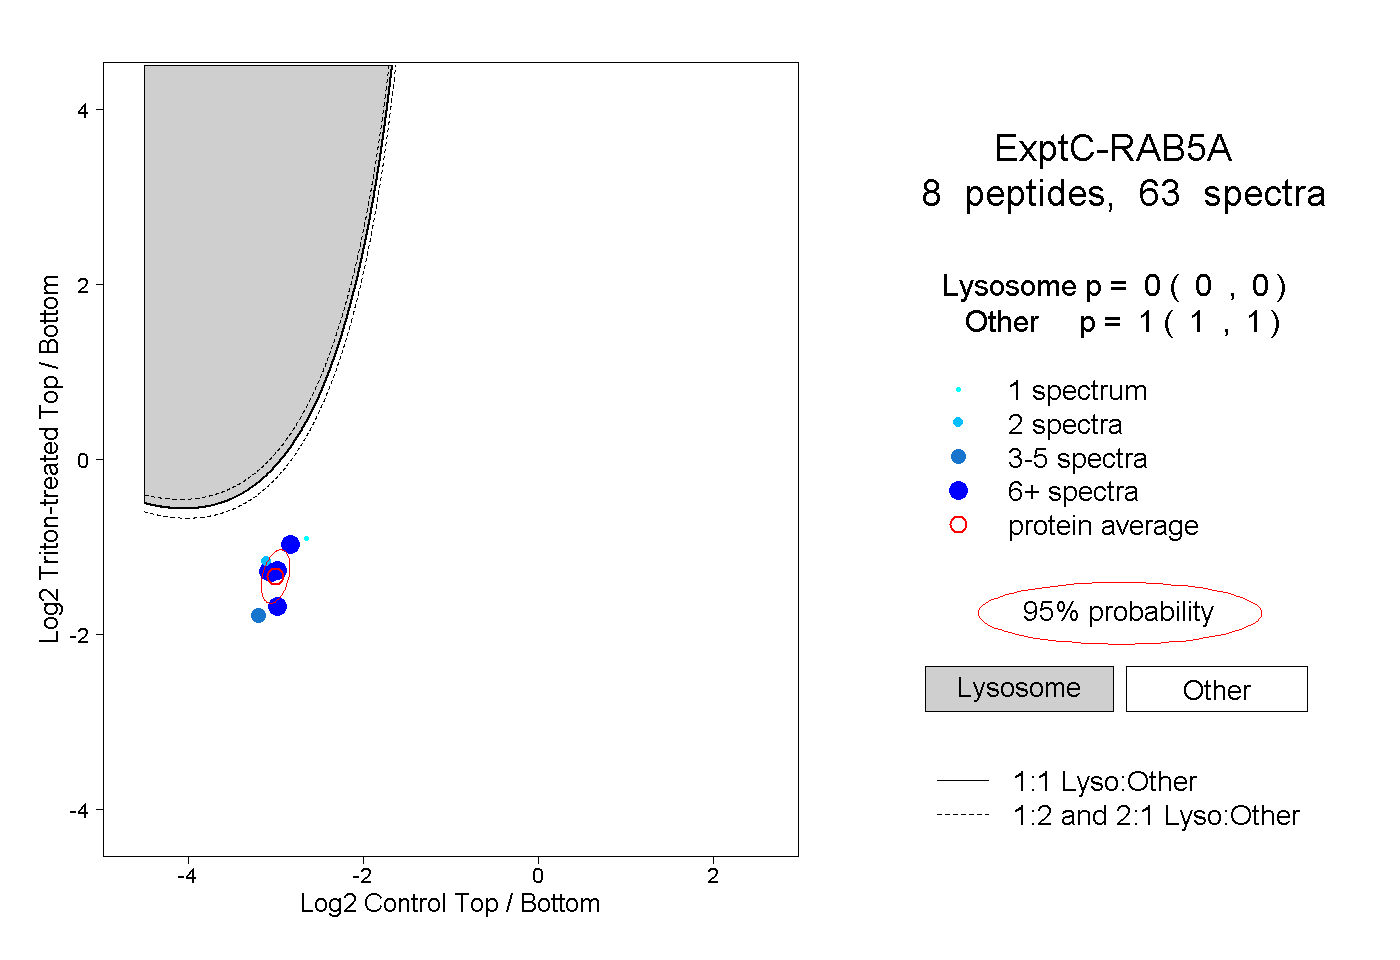
0.000 | 0.000
1.000 | 1.000
7peptides
spectra
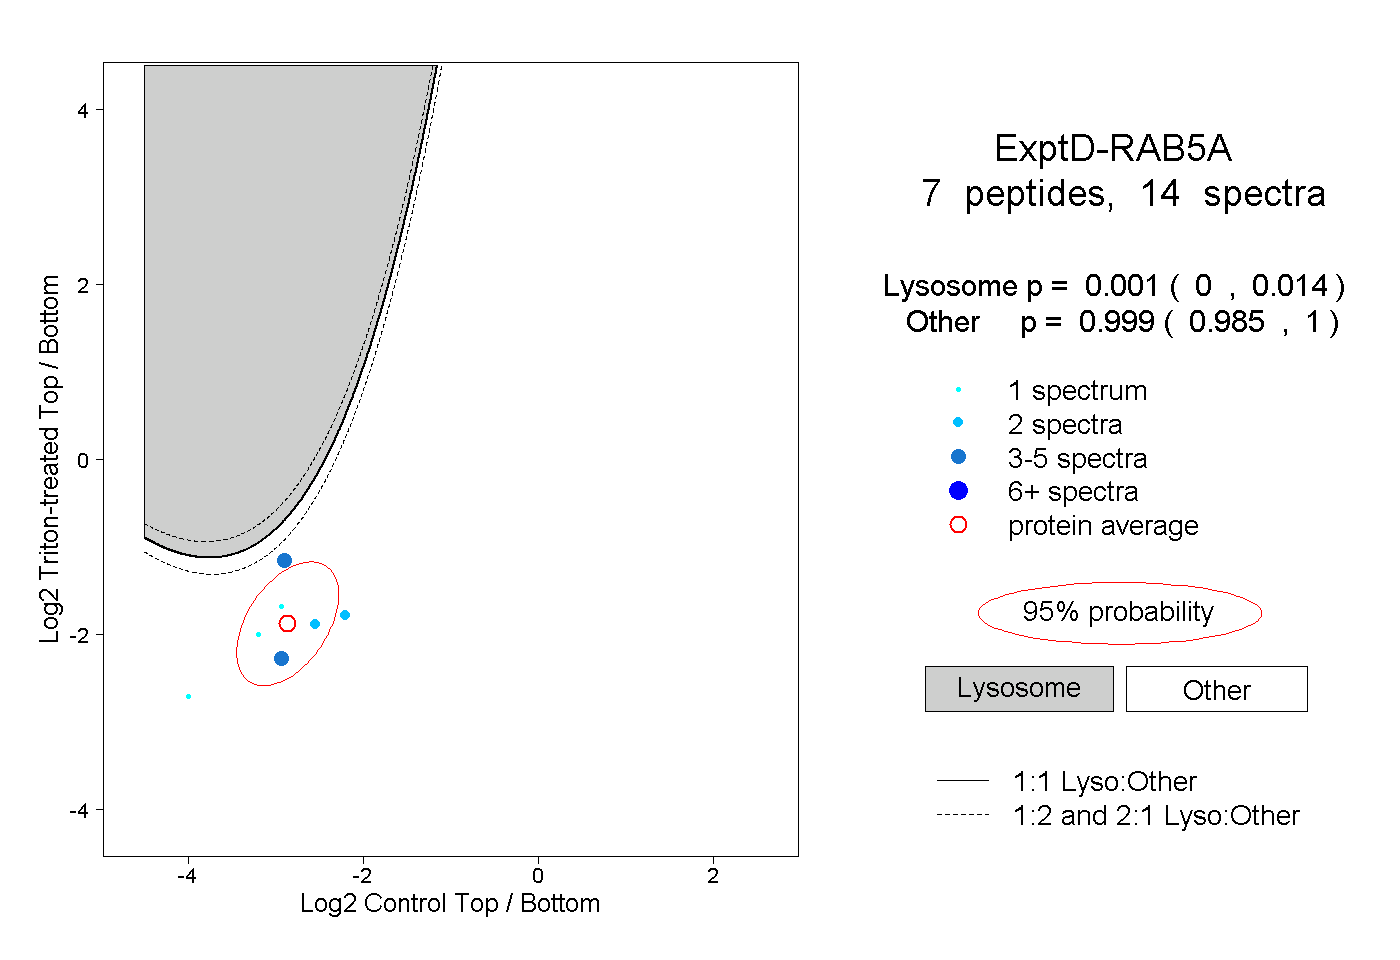
0.000 | 0.014
0.985 | 1.000