 5
5peptides
spectra
0.000 | 0.000
0.117 | 0.179
0.175 | 0.255
0.000 | 0.000
0.026 | 0.142
0.266 | 0.374
0.193 | 0.241
0.000 | 0.000
| Plot | Mito | Lyso | Perox | ER | Golgi | PM | Cytosol | Nucleus | |||||
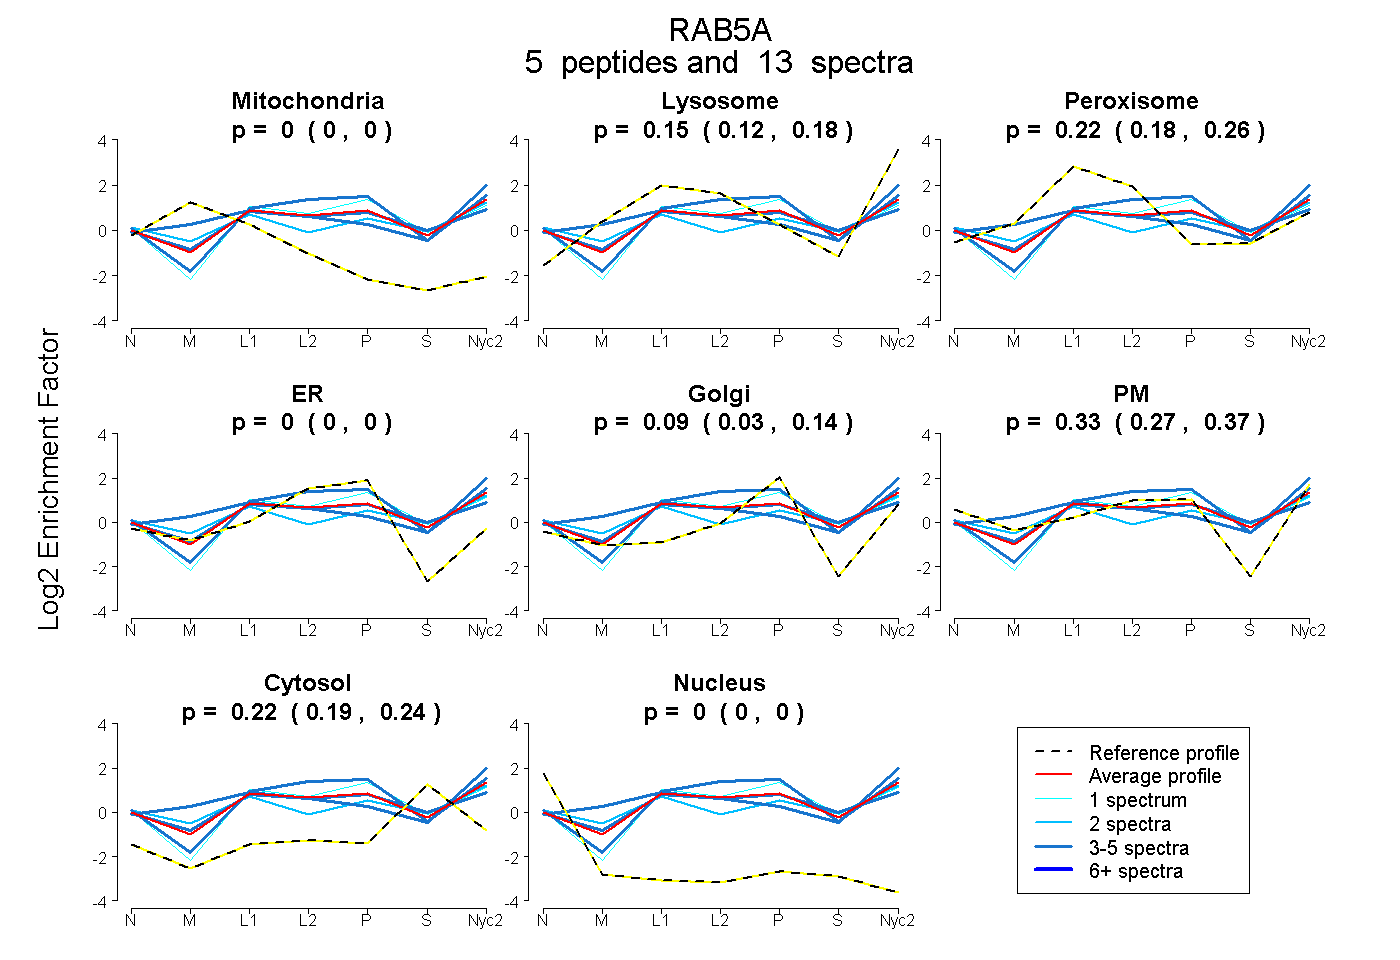
| Expt A |
5 peptides |
13 spectra |
|
0.000 0.000 | 0.000 |
0.151 0.117 | 0.179 |
0.218 0.175 | 0.255 |
0.000 0.000 | 0.000 |
0.086 0.026 | 0.142 |
0.325 0.266 | 0.374 |
0.219 0.193 | 0.241 |
0.000 0.000 | 0.000 |
| 3 spectra, NEPQNPGANSAR | 0.000 | 0.241 | 0.072 | 0.251 | 0.000 | 0.264 | 0.172 | 0.000 | ||
| 4 spectra, GVDLTEPAQPAR | 0.000 | 0.048 | 0.364 | 0.000 | 0.199 | 0.167 | 0.221 | 0.000 | ||
| 2 spectra, GAQAAIVVYDITNEESFSR | 0.000 | 0.132 | 0.176 | 0.000 | 0.000 | 0.391 | 0.301 | 0.000 | ||
| 1 spectrum, GATRPNGPNTGNK | 0.000 | 0.058 | 0.287 | 0.000 | 0.301 | 0.138 | 0.216 | 0.000 | ||
| 3 spectra, QASPNIVIALSGNK | 0.000 | 0.345 | 0.158 | 0.000 | 0.000 | 0.333 | 0.164 | 0.000 |
| Plot | Mito | Lyso or Perox | ER | Golgi | PM | Cytosol | Nucleus | ||||||
| Expt B |
3 peptides |
8 spectra |
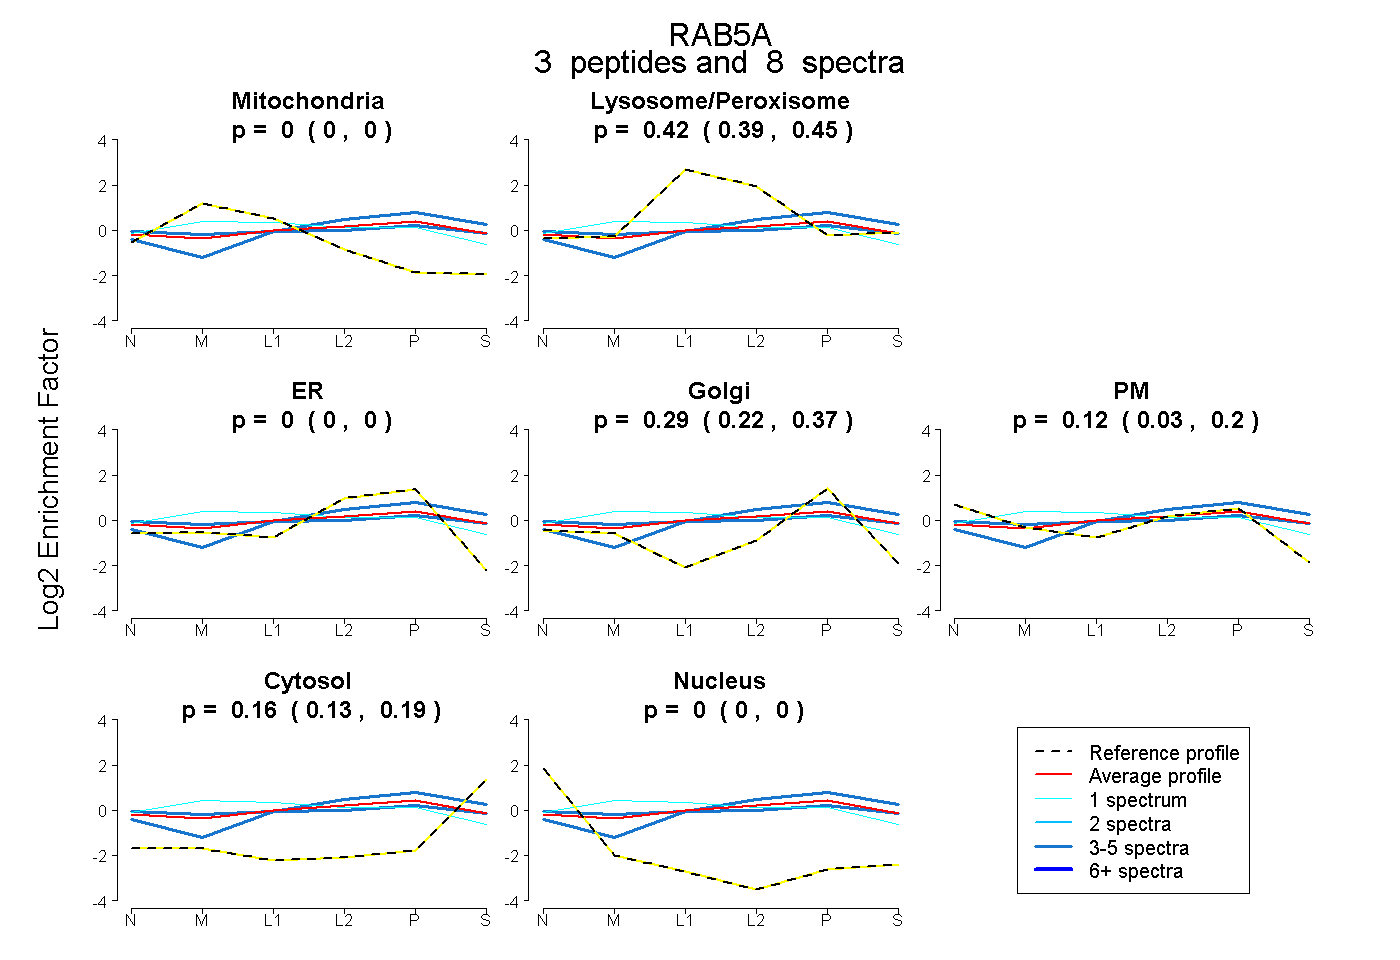 |
0.000 0.000 | 0.000 |
0.419 0.388 | 0.446 |
0.000 0.000 | 0.000 |
0.294 0.215 | 0.368 |
0.123 0.032 | 0.200 |
0.164 0.127 | 0.193 |
0.000 0.000 | 0.000 |
|||
| Plot | Lyso | Other | |||||||||||
| Expt C |
8 peptides |
63 spectra |
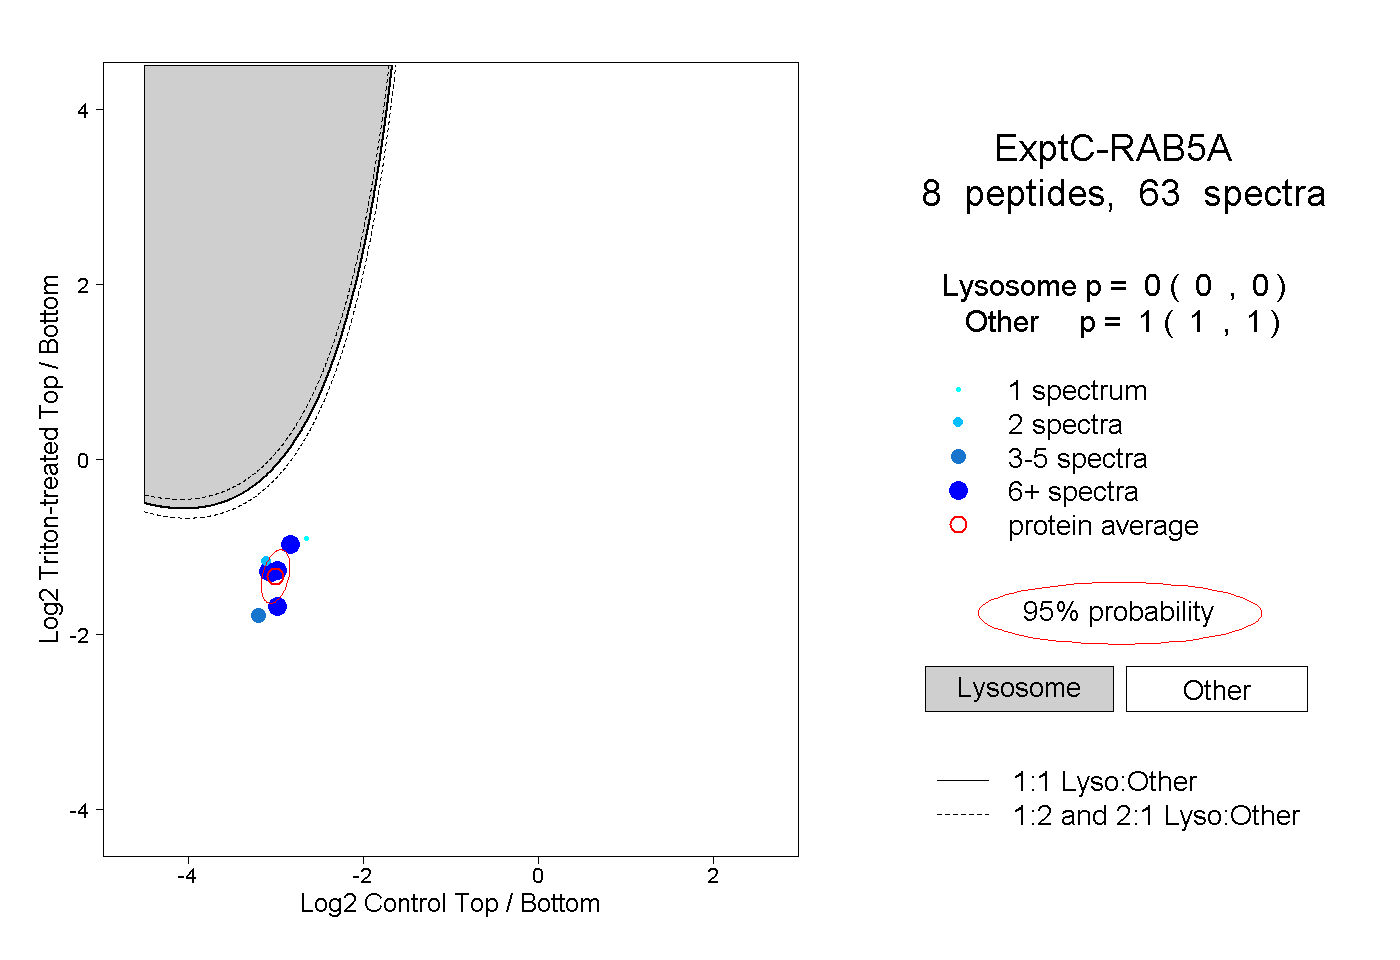 |
0.000 0.000 | 0.000 |
1.000 1.000 | 1.000 |
||||||||
| Plot | Lyso | Other | |||||||||||
| Expt D |
7 peptides |
14 spectra |
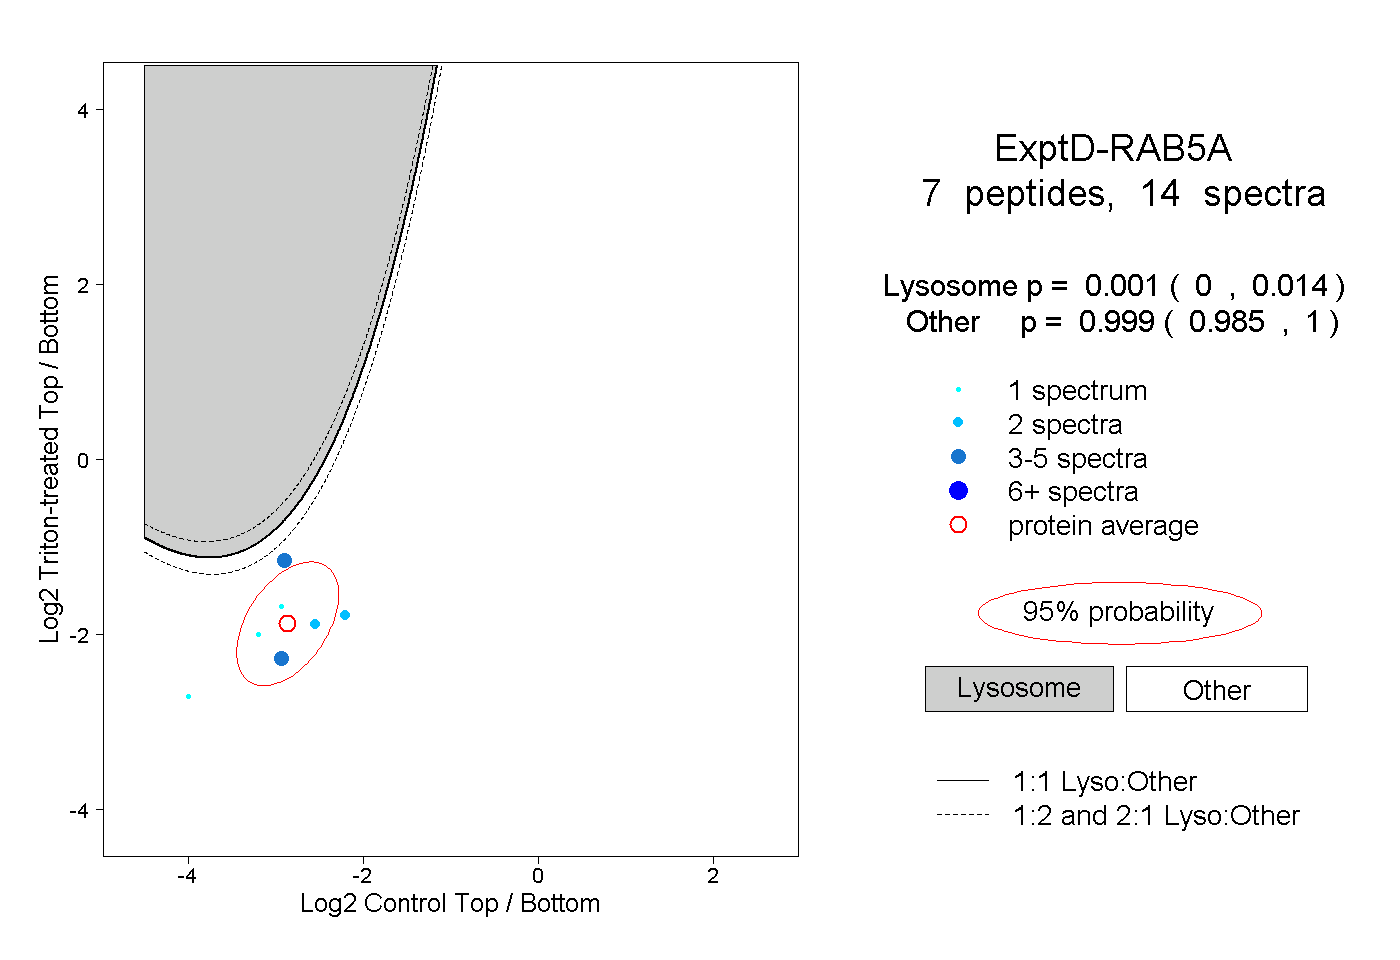 |
0.001 0.000 | 0.014 |
0.999 0.985 | 1.000 |