 6
6peptides
spectra
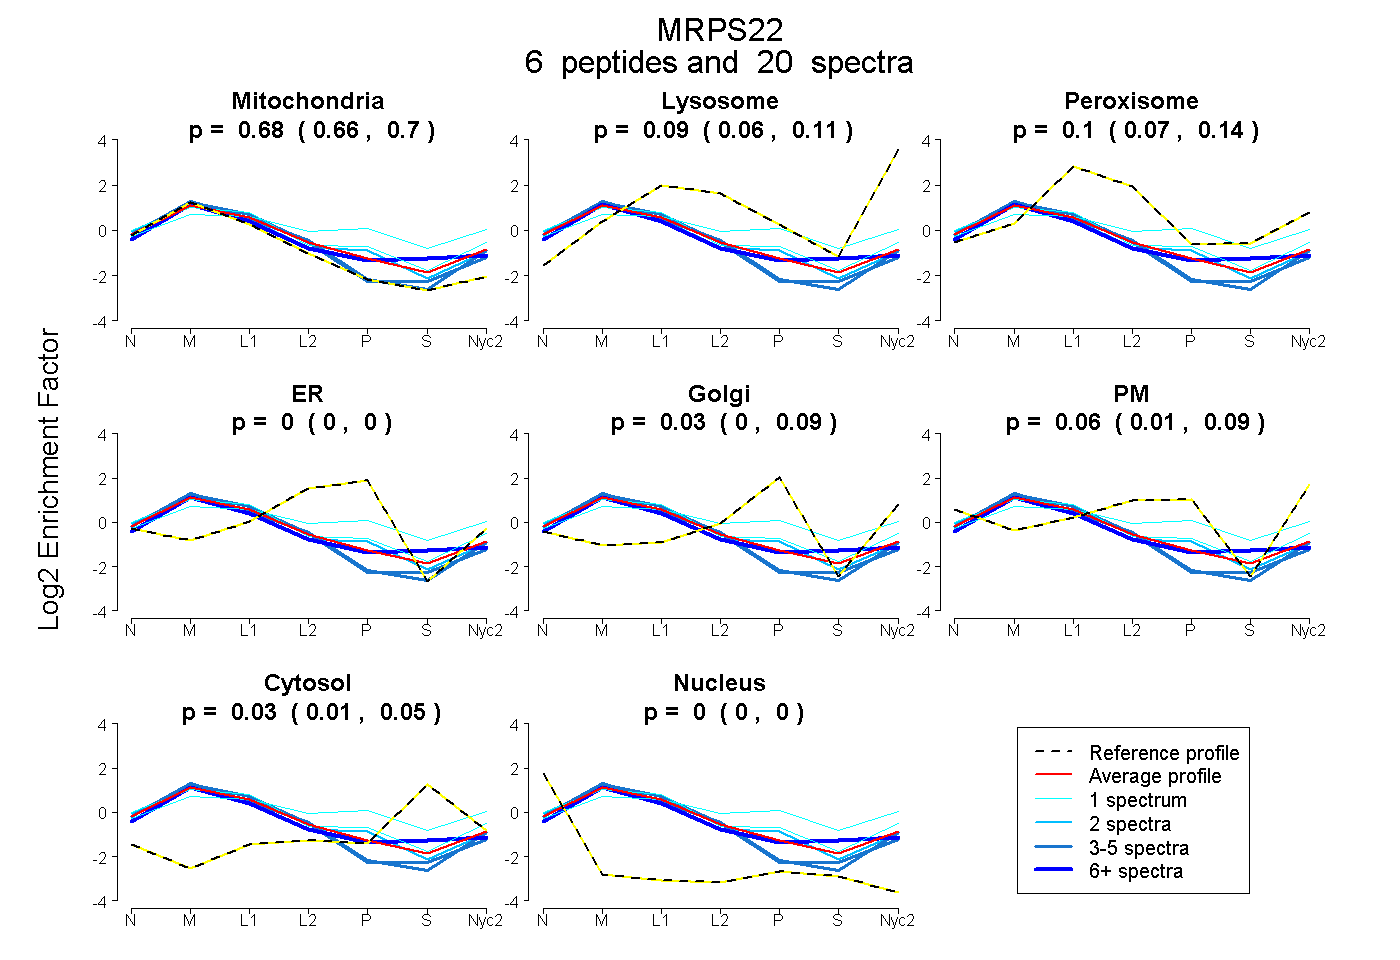
0.658 | 0.703
0.061 | 0.109
0.070 | 0.136
0.000 | 0.000
0.000 | 0.091
0.009 | 0.088
0.009 | 0.051
0.000 | 0.000
1peptide
spectra
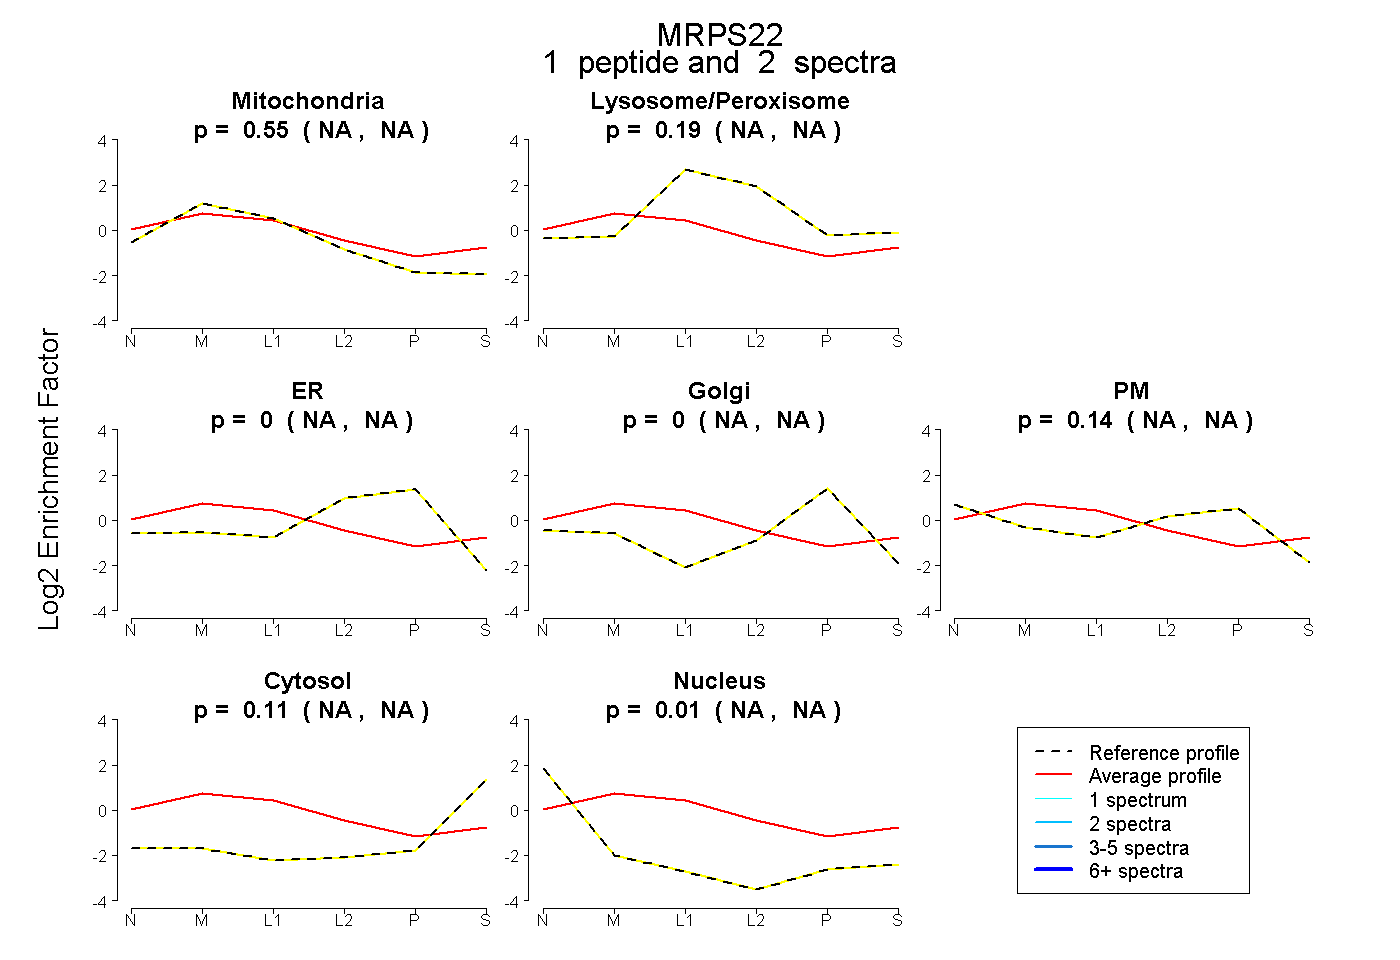
NA | NA
NA | NA
NA | NA
NA | NA
NA | NA
NA | NA
NA | NA
15peptides
spectra
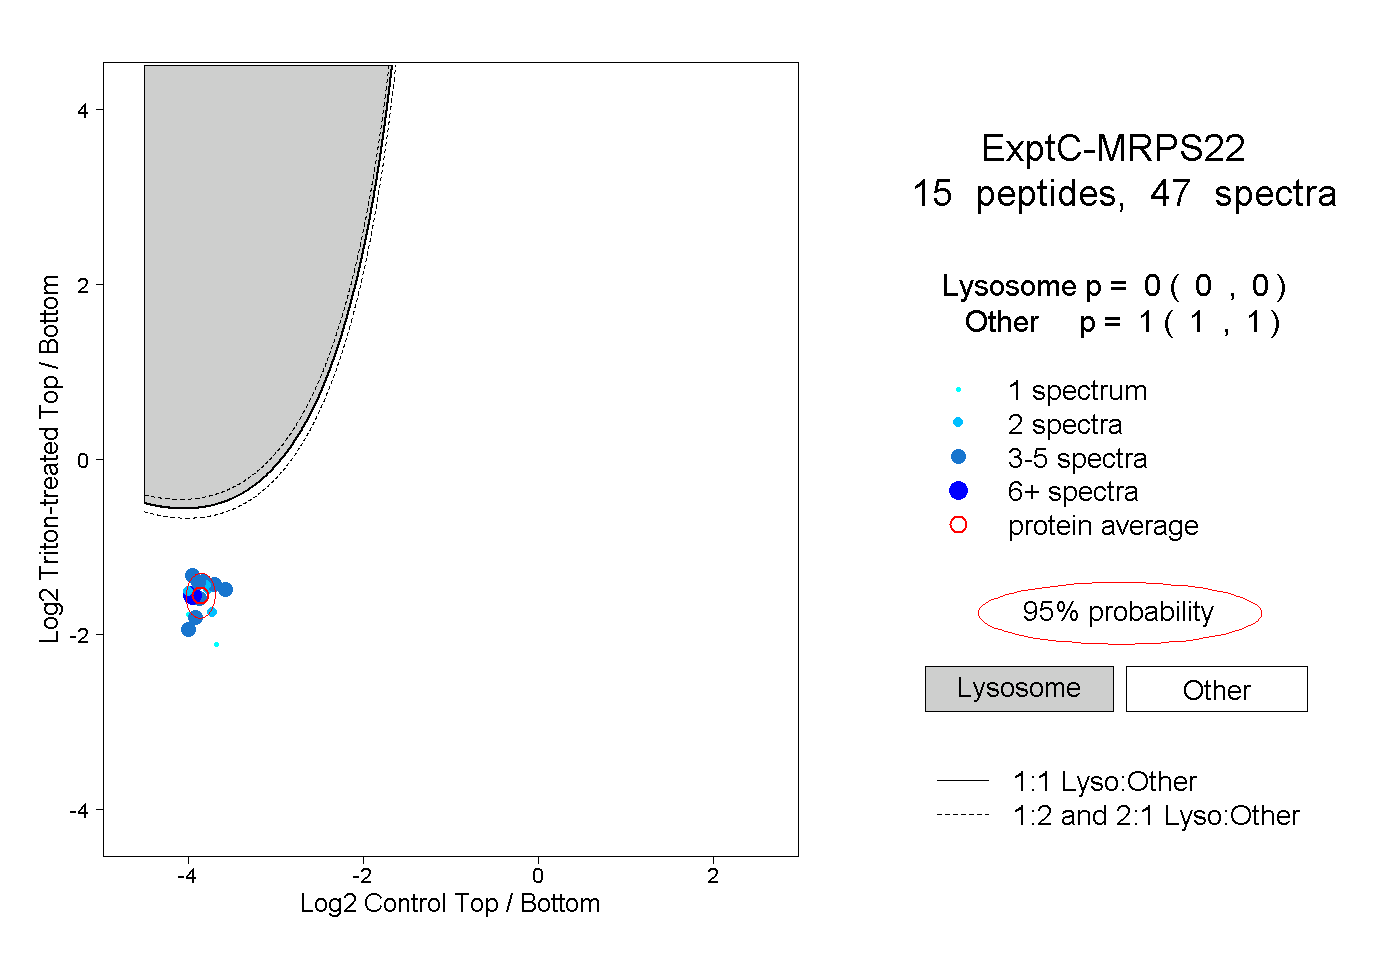
0.000 | 0.000
1.000 | 1.000
2peptides
spectra
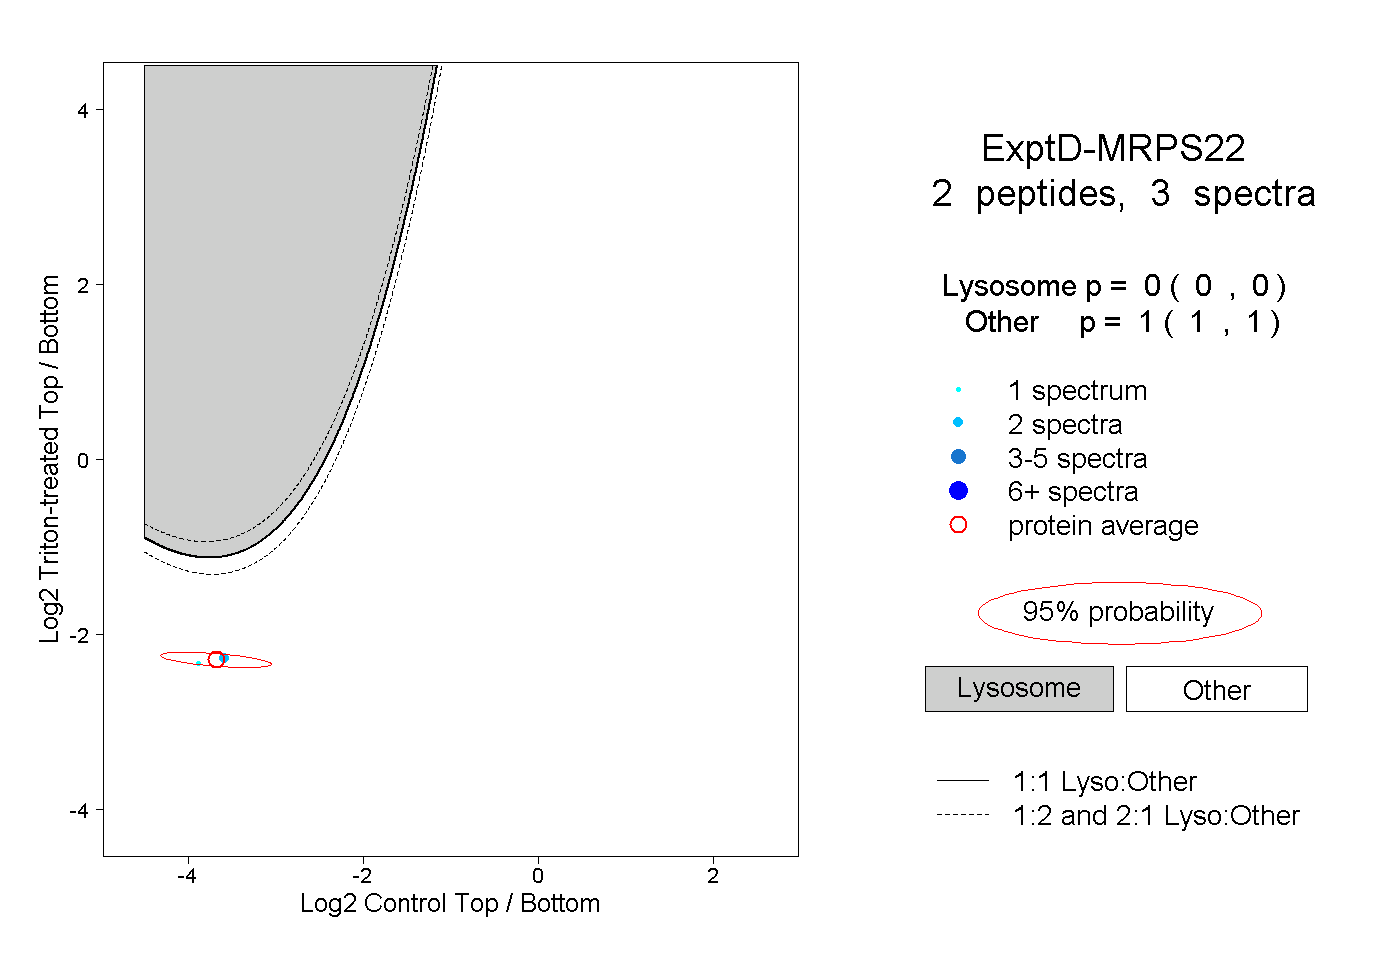
0.000 | 0.000
1.000 | 1.000