 6
6peptides
spectra
0.658 | 0.703
0.061 | 0.109
0.070 | 0.136
0.000 | 0.000
0.000 | 0.091
0.009 | 0.088
0.009 | 0.051
0.000 | 0.000
| Plot | Mito | Lyso | Perox | ER | Golgi | PM | Cytosol | Nucleus | |||||
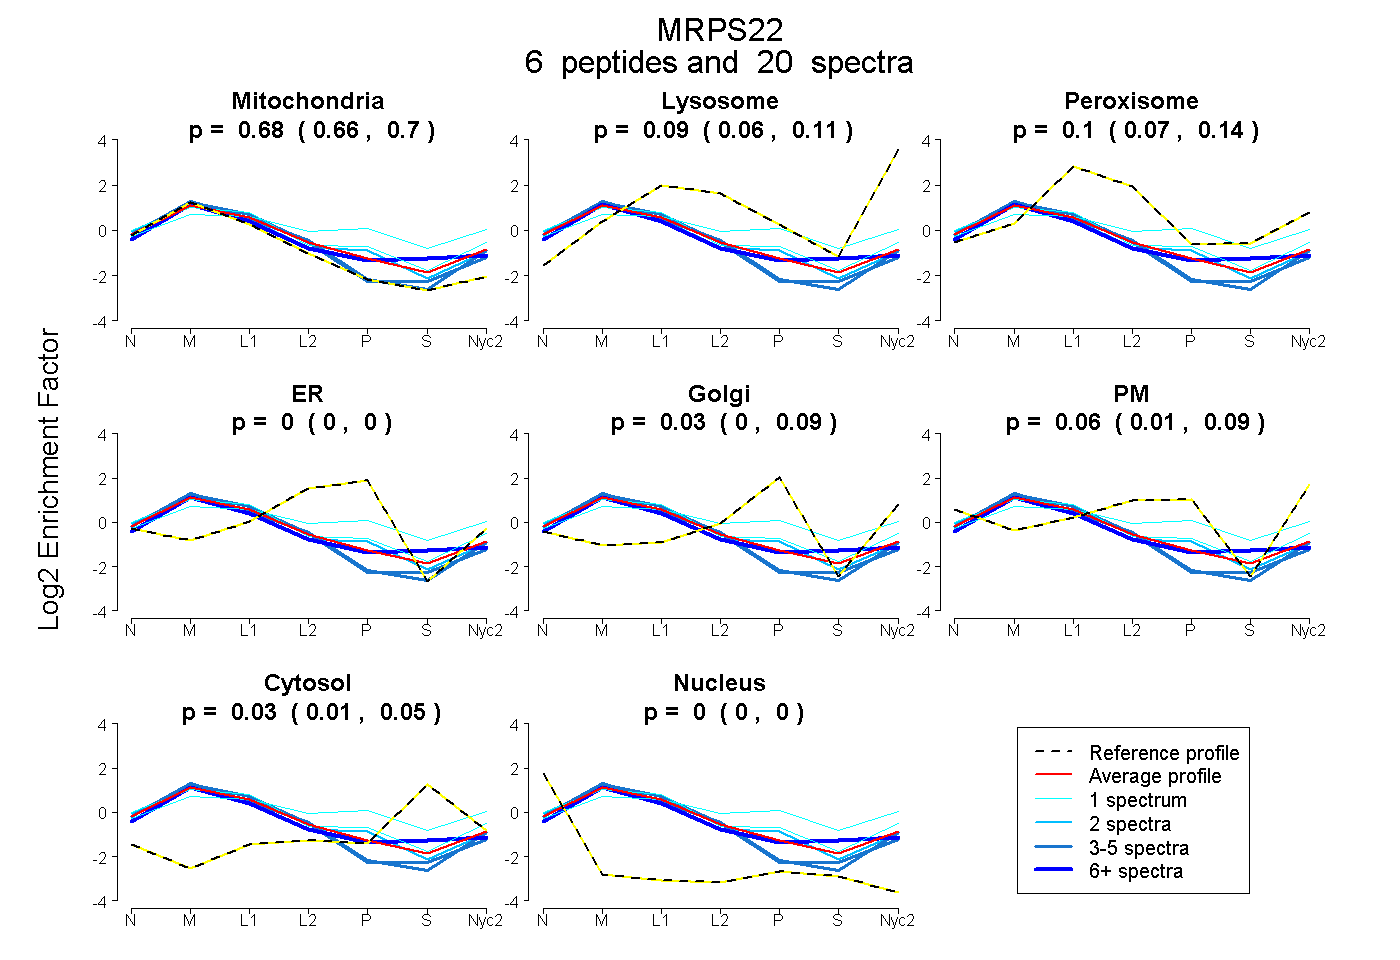
| Expt A |
6 peptides |
20 spectra |
|
0.684 0.658 | 0.703 |
0.088 0.061 | 0.109 |
0.101 0.070 | 0.136 |
0.000 0.000 | 0.000 |
0.029 0.000 | 0.091 |
0.065 0.009 | 0.088 |
0.034 0.009 | 0.051 |
0.000 0.000 | 0.000 |
| 4 spectra, LMTQAQLEEATR | 0.843 | 0.157 | 0.000 | 0.000 | 0.000 | 0.000 | 0.000 | 0.000 | ||
| 3 spectra, MPPVLEER | 0.825 | 0.047 | 0.129 | 0.000 | 0.000 | 0.000 | 0.000 | 0.000 | ||
| 2 spectra, EPSGTLR | 0.685 | 0.040 | 0.072 | 0.000 | 0.142 | 0.061 | 0.000 | 0.000 | ||
| 9 spectra, TMYSQDR | 0.671 | 0.083 | 0.109 | 0.000 | 0.000 | 0.000 | 0.137 | 0.000 | ||
| 1 spectrum, VHHQTYEDIDR | 0.266 | 0.050 | 0.323 | 0.000 | 0.266 | 0.000 | 0.094 | 0.000 | ||
| 1 spectrum, YVFTDISYNIPHR | 0.579 | 0.064 | 0.164 | 0.000 | 0.133 | 0.060 | 0.000 | 0.000 |
| Plot | Mito | Lyso or Perox | ER | Golgi | PM | Cytosol | Nucleus | ||||||
| Expt B |
1 peptide |
2 spectra |
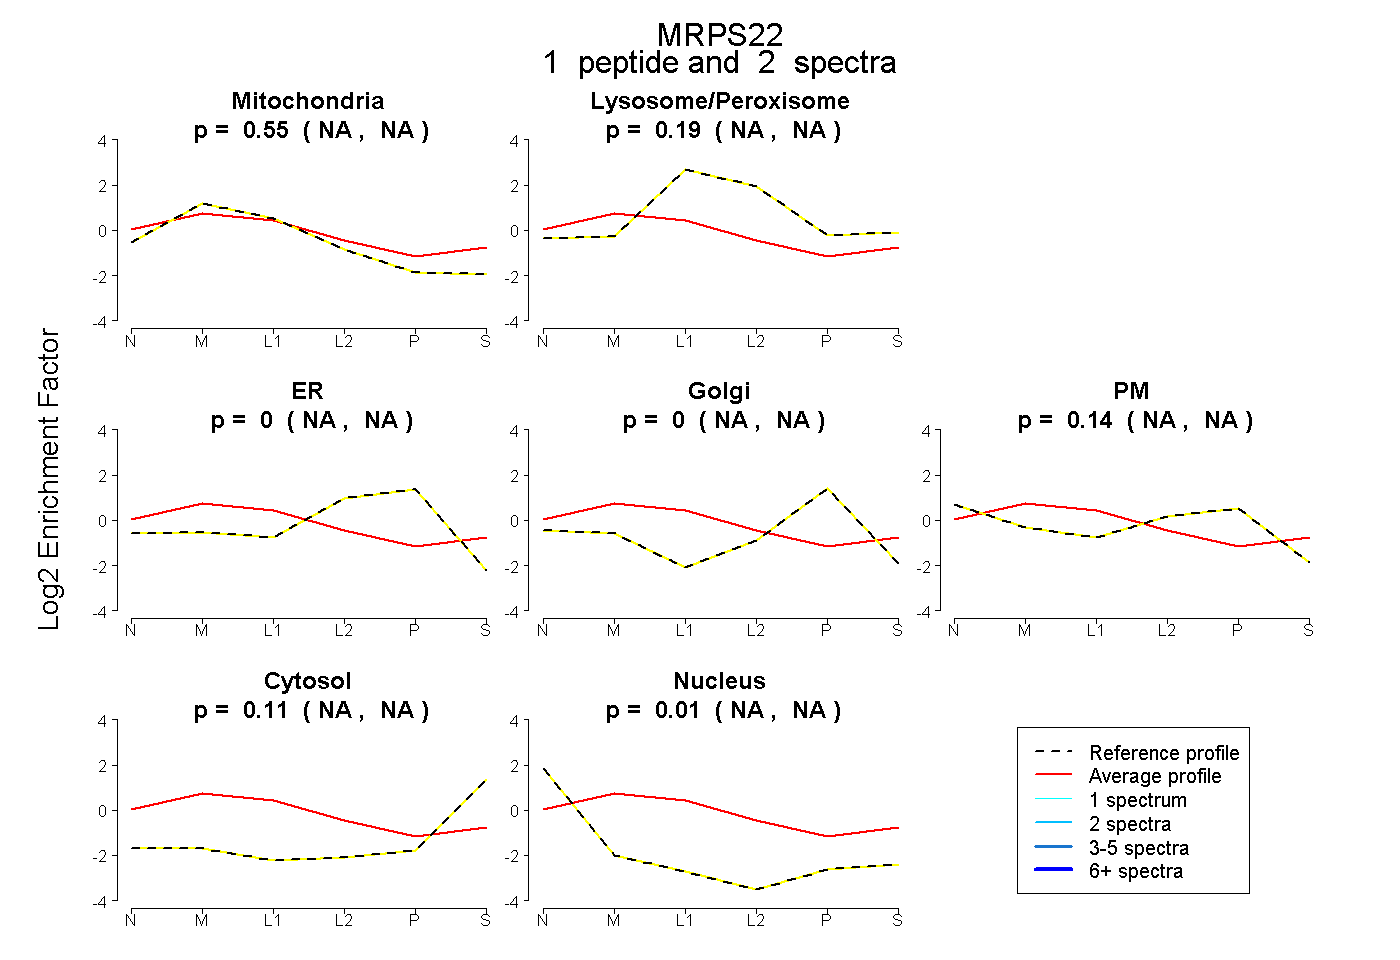 |
0.547 NA | NA |
0.192 NA | NA |
0.000 NA | NA |
0.000 NA | NA |
0.140 NA | NA |
0.114 NA | NA |
0.007 NA | NA |
|||
| Plot | Lyso | Other | |||||||||||
| Expt C |
15 peptides |
47 spectra |
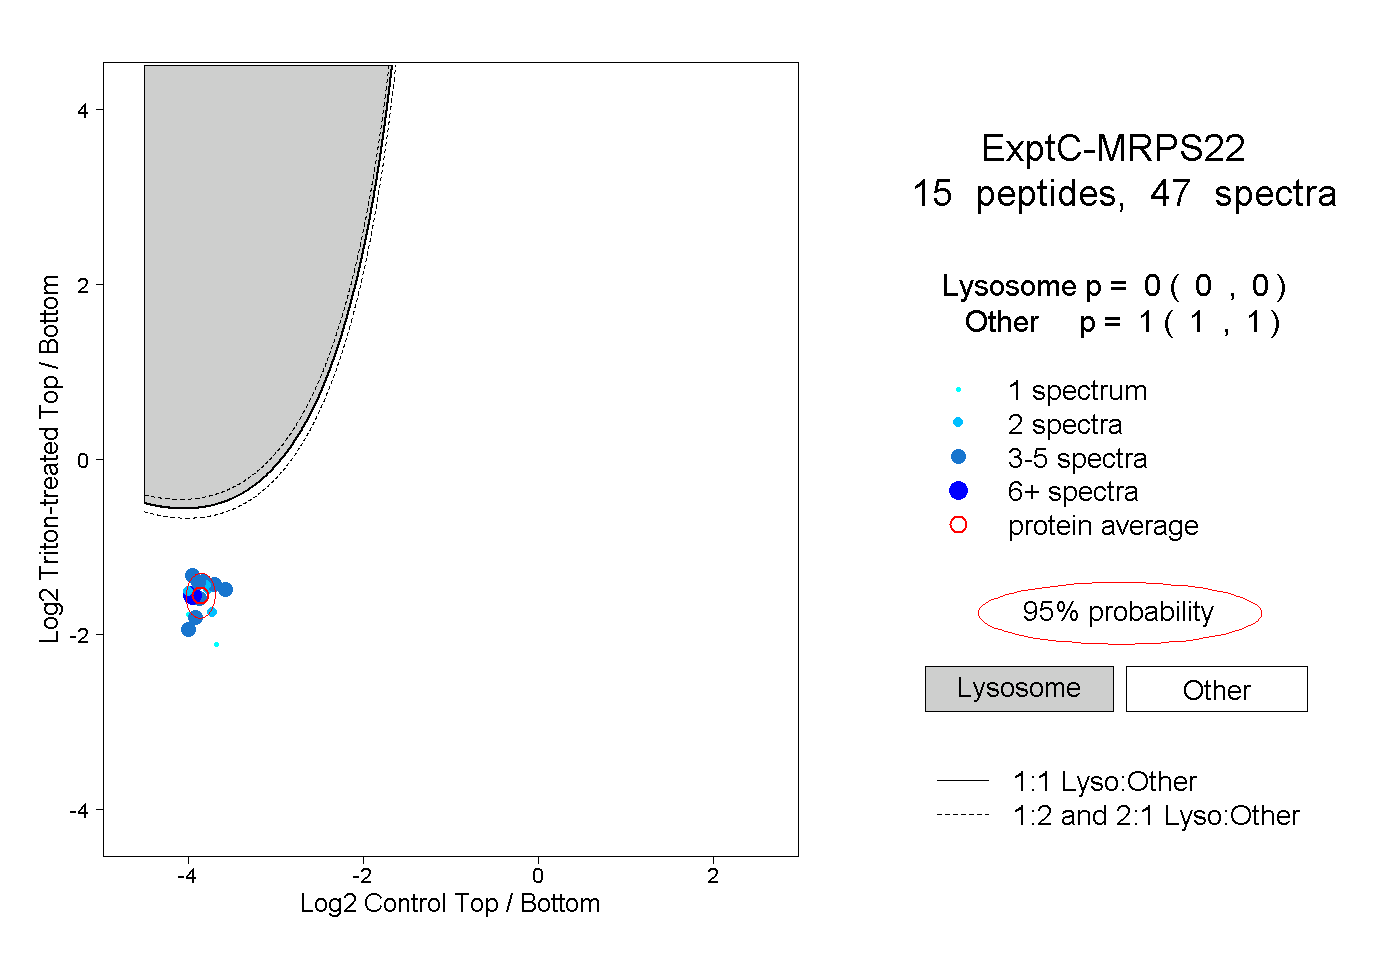 |
0.000 0.000 | 0.000 |
1.000 1.000 | 1.000 |
||||||||
| Plot | Lyso | Other | |||||||||||
| Expt D |
2 peptides |
3 spectra |
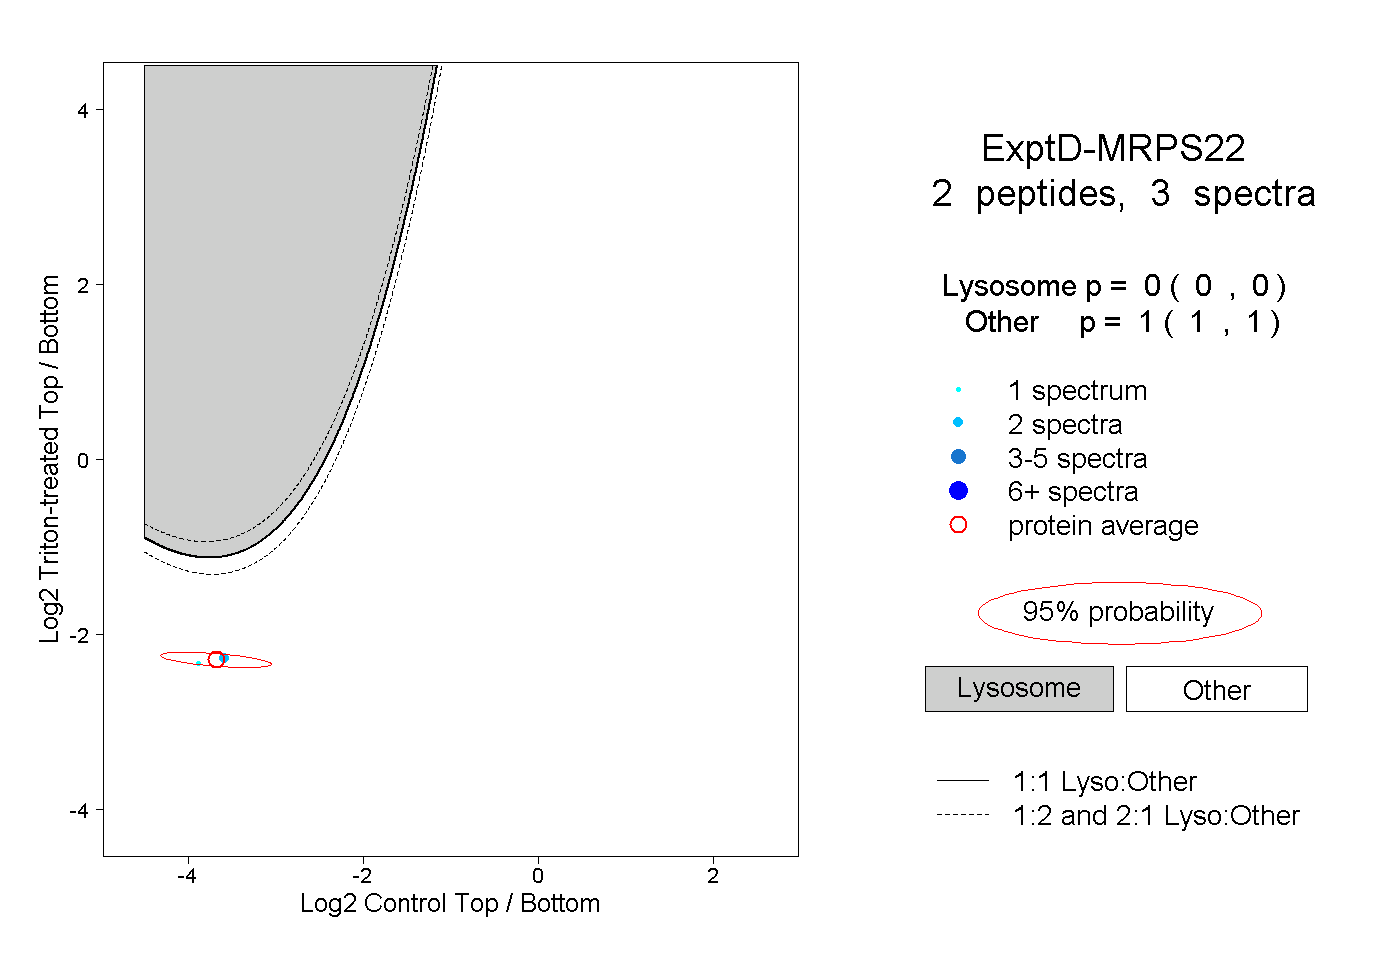 |
0.000 0.000 | 0.000 |
1.000 1.000 | 1.000 |