 5
5peptides
spectra
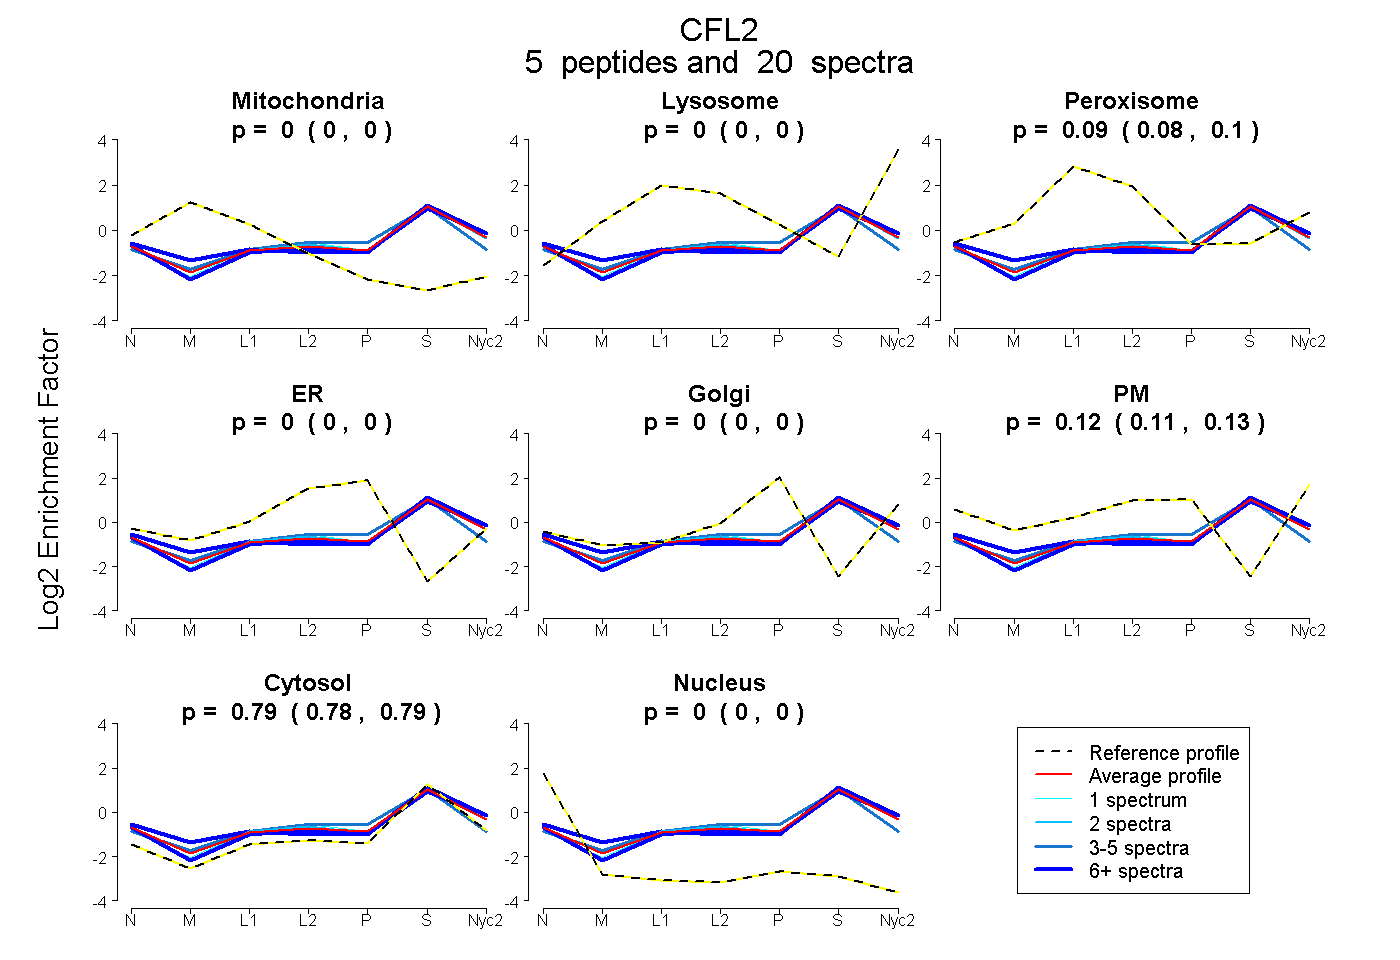
0.000 | 0.000
0.000 | 0.000
0.083 | 0.099
0.000 | 0.000
0.000 | 0.000
0.112 | 0.127
0.780 | 0.795
0.000 | 0.000
3peptides
spectra
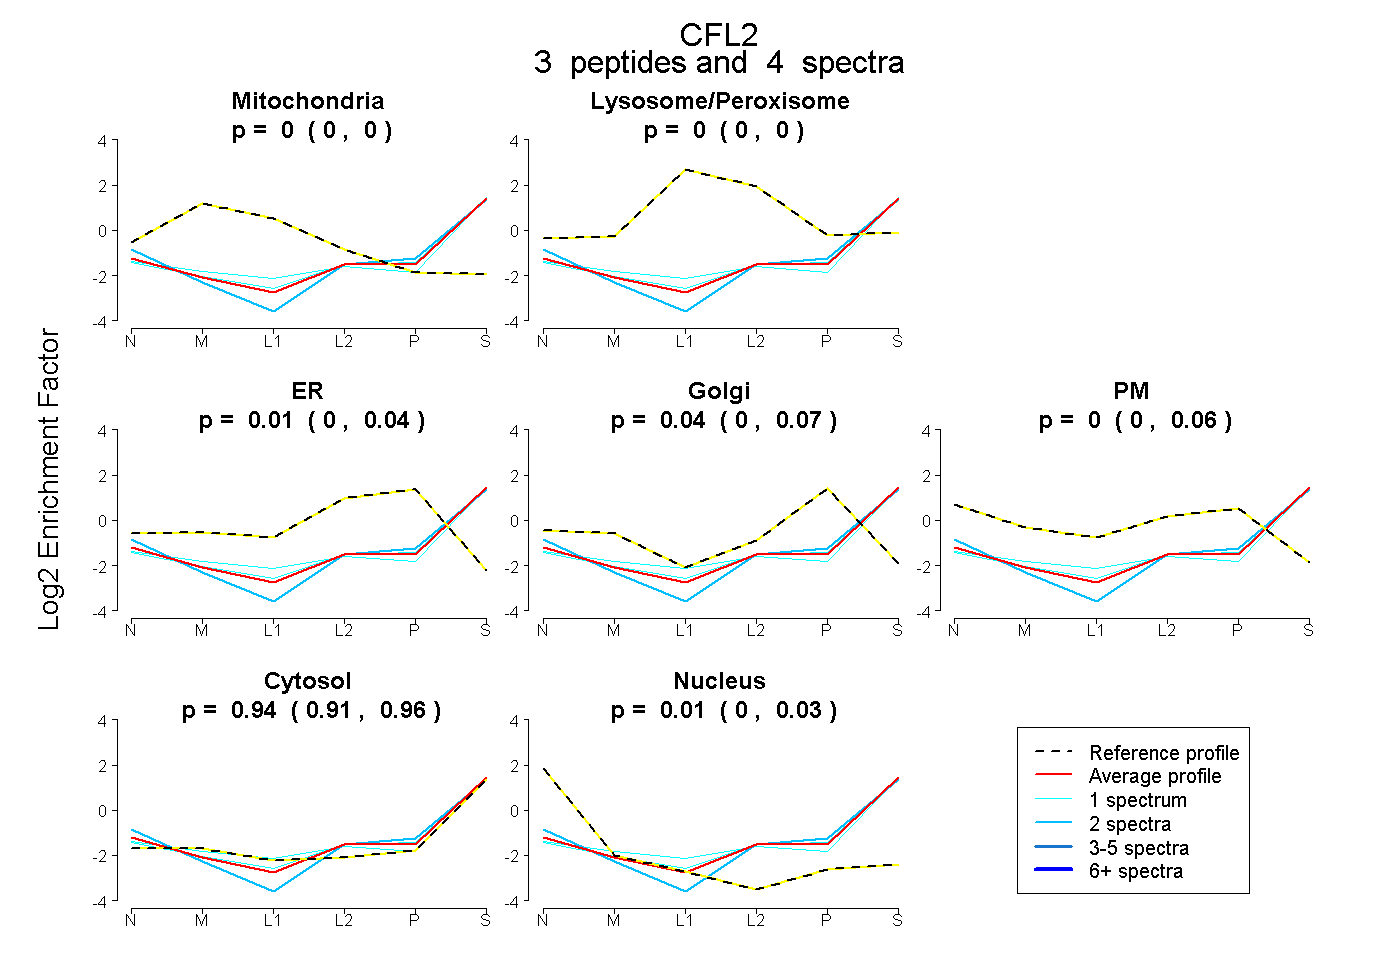
0.000 | 0.000
0.000 | 0.000
0.000 | 0.043
0.000 | 0.067
0.000 | 0.063
0.913 | 0.959
0.000 | 0.032
4peptides
spectra
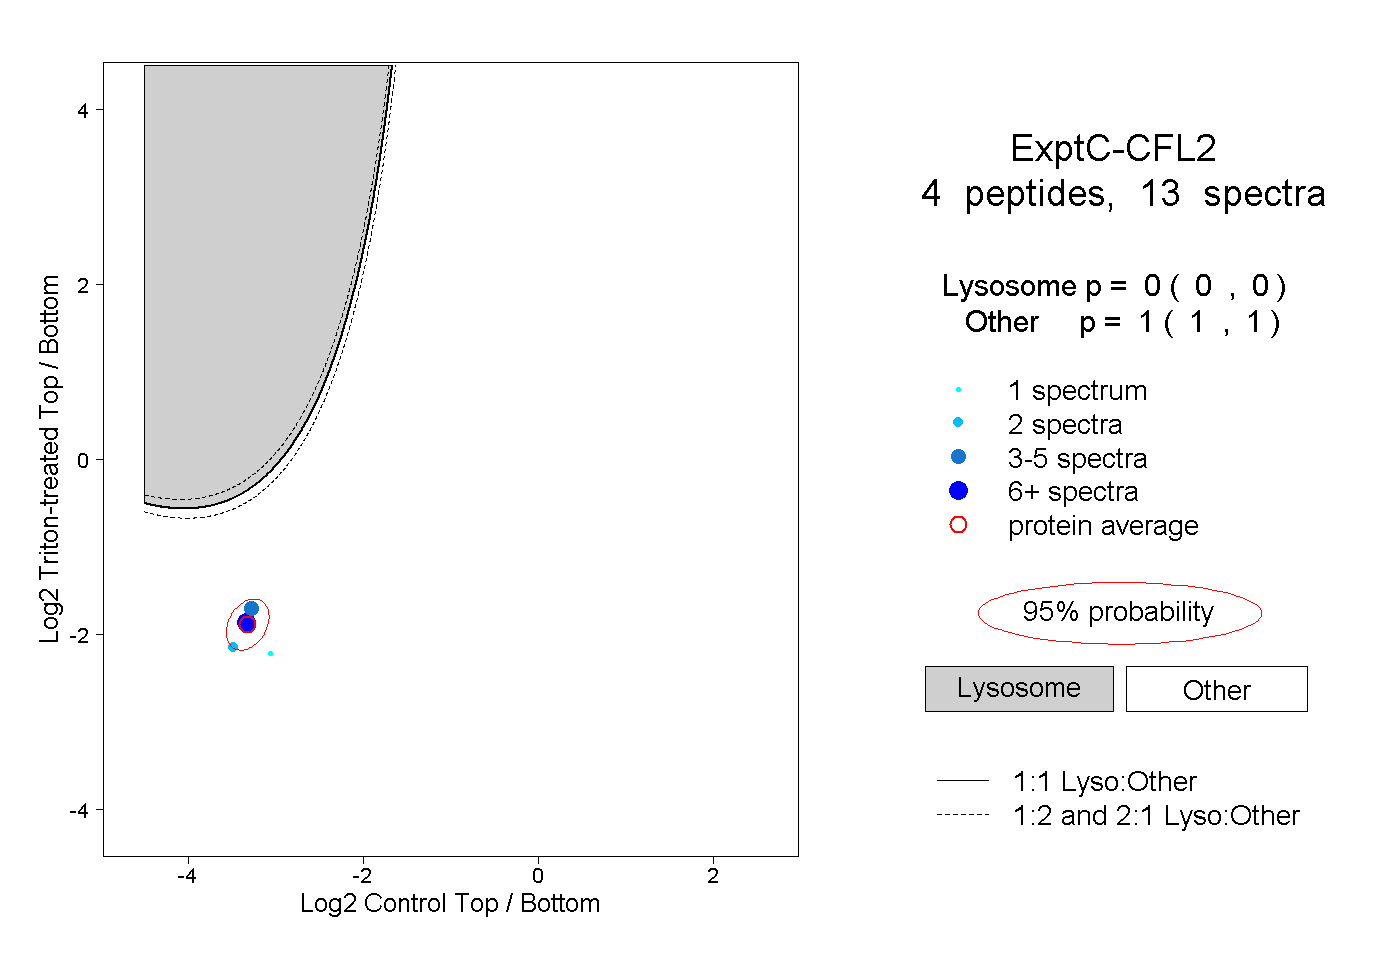
0.000 | 0.000
1.000 | 1.000
1peptide
spectrum
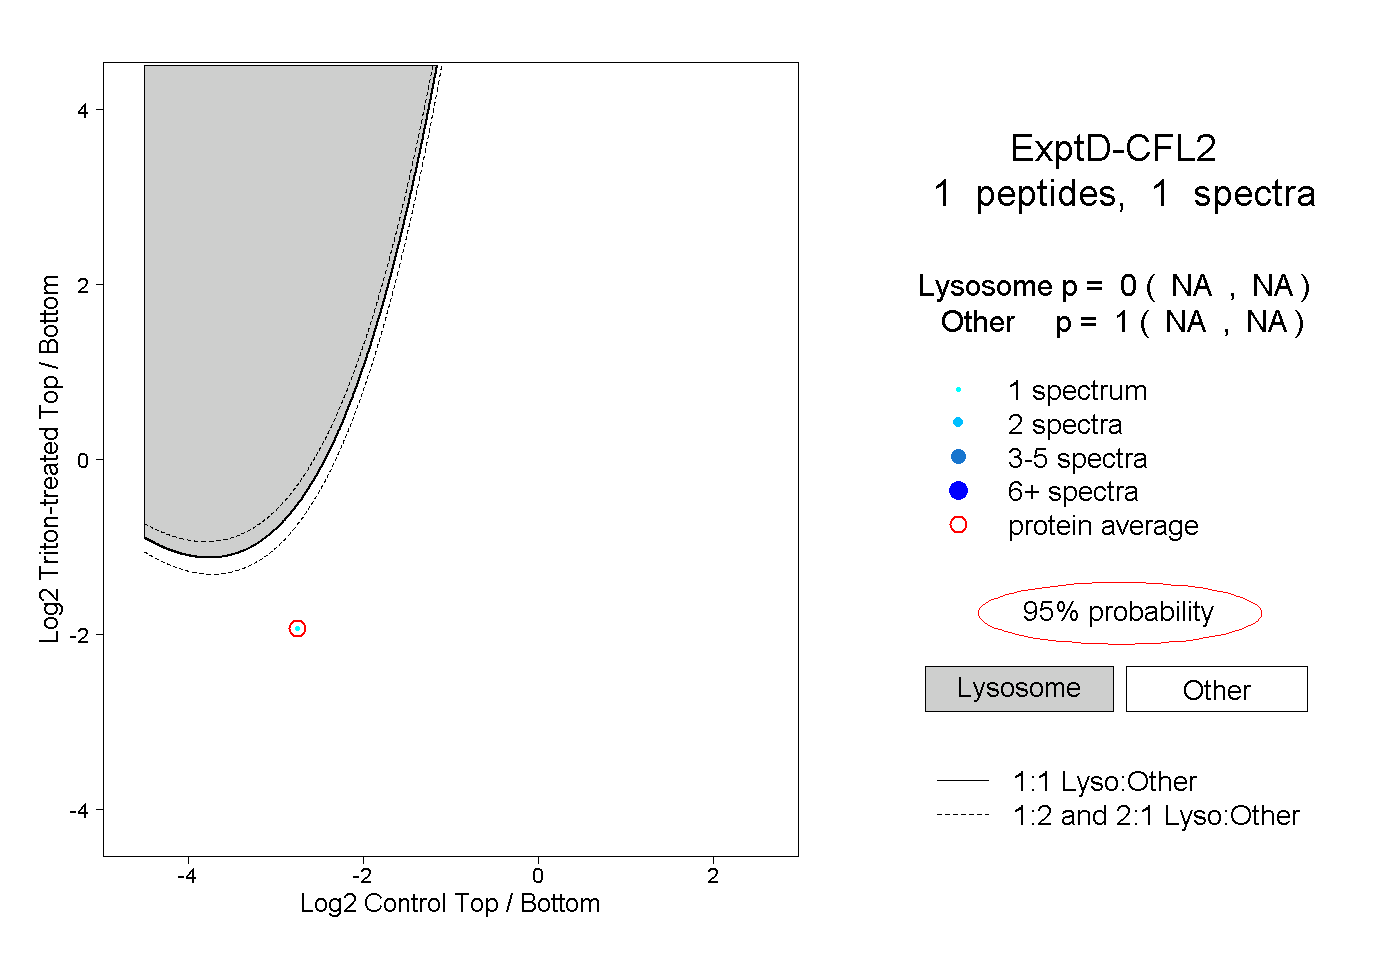
NA | NA
NA | NA