 5
5peptides
spectra
0.000 | 0.000
0.000 | 0.000
0.083 | 0.099
0.000 | 0.000
0.000 | 0.000
0.112 | 0.127
0.780 | 0.795
0.000 | 0.000
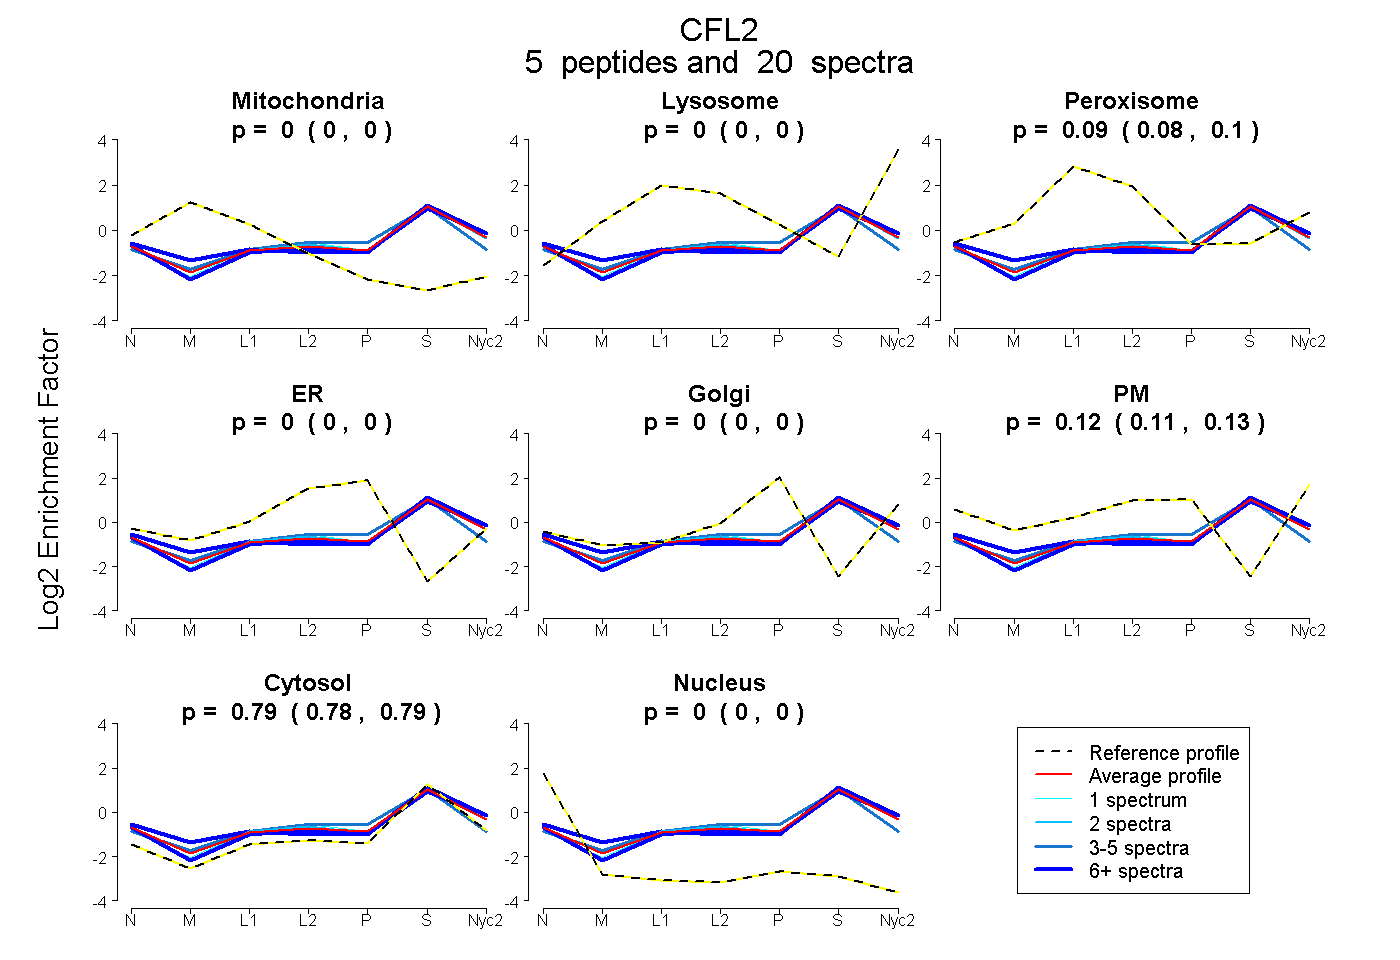
| Plot | Mito | Lyso | Perox | ER | Golgi | PM | Cytosol | Nucleus | |||||
| Expt A |
5 peptides |
20 spectra |
|
0.000 0.000 | 0.000 |
0.000 0.000 | 0.000 |
0.092 0.083 | 0.099 |
0.000 0.000 | 0.000 |
0.000 0.000 | 0.000 |
0.120 0.112 | 0.127 |
0.788 0.780 | 0.795 |
0.000 0.000 | 0.000 |
| 3 spectra, LLPLNDCR | 0.000 | 0.000 | 0.103 | 0.133 | 0.000 | 0.000 | 0.764 | 0.000 | ||
| 1 spectrum, LGGSVVVSLEGKPL | 0.000 | 0.042 | 0.089 | 0.000 | 0.000 | 0.080 | 0.789 | 0.000 | ||
| 2 spectra, SSTQEEIK | 0.000 | 0.000 | 0.090 | 0.000 | 0.000 | 0.105 | 0.805 | 0.000 | ||
| 8 spectra, STLGEK | 0.000 | 0.007 | 0.055 | 0.000 | 0.000 | 0.120 | 0.817 | 0.000 | ||
| 6 spectra, QIIVEEAK | 0.040 | 0.022 | 0.071 | 0.000 | 0.000 | 0.130 | 0.737 | 0.000 |
| Plot | Mito | Lyso or Perox | ER | Golgi | PM | Cytosol | Nucleus | ||||||
| Expt B |
3 peptides |
4 spectra |
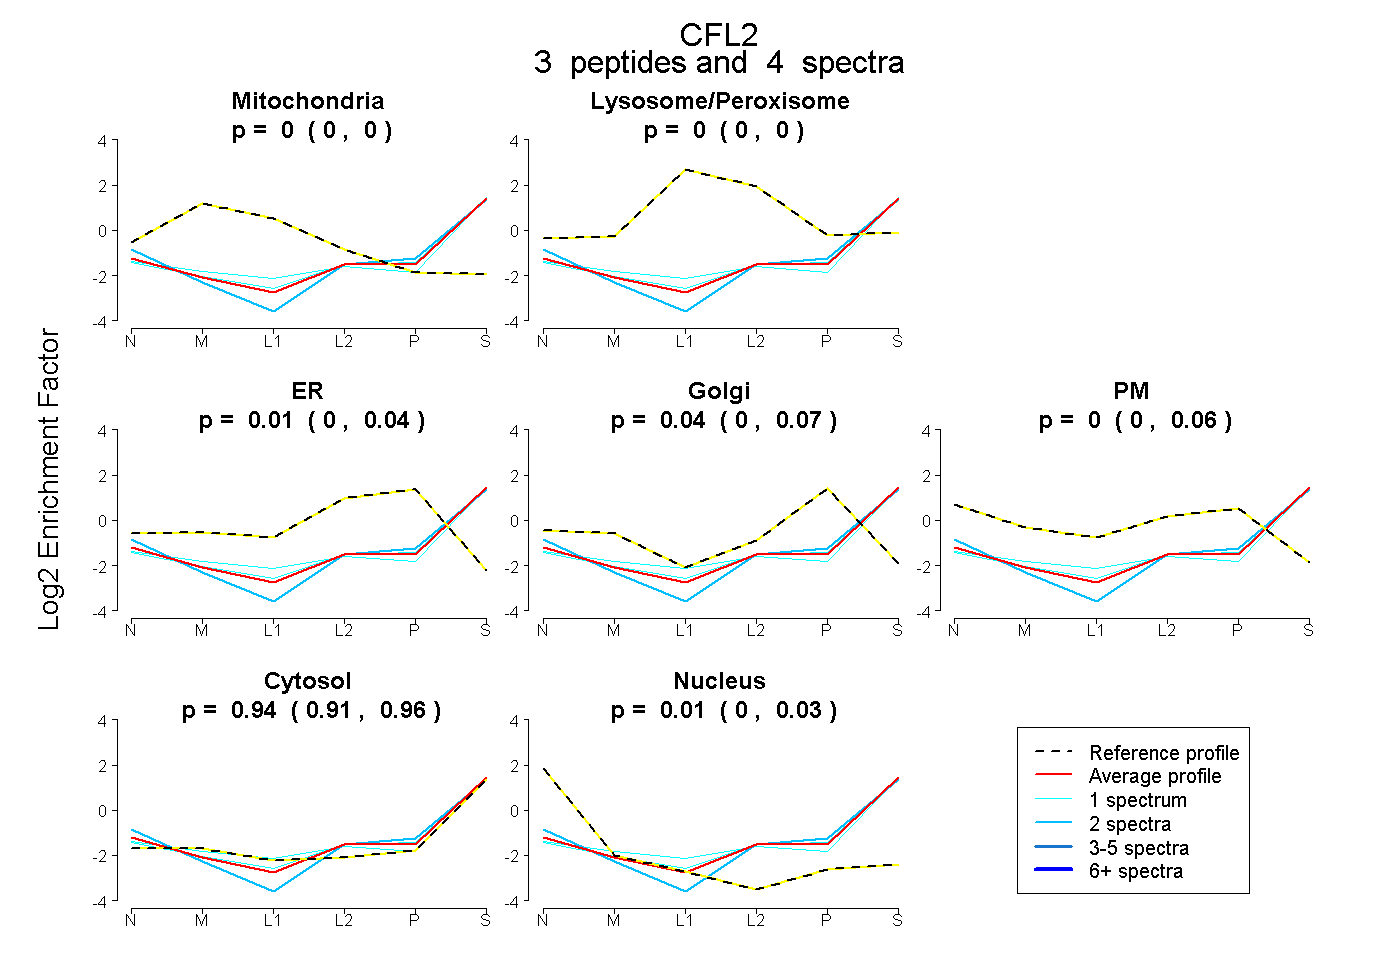 |
0.000 0.000 | 0.000 |
0.000 0.000 | 0.000 |
0.010 0.000 | 0.043 |
0.040 0.000 | 0.067 |
0.000 0.000 | 0.063 |
0.941 0.913 | 0.959 |
0.009 0.000 | 0.032 |
|||
| Plot | Lyso | Other | |||||||||||
| Expt C |
4 peptides |
13 spectra |
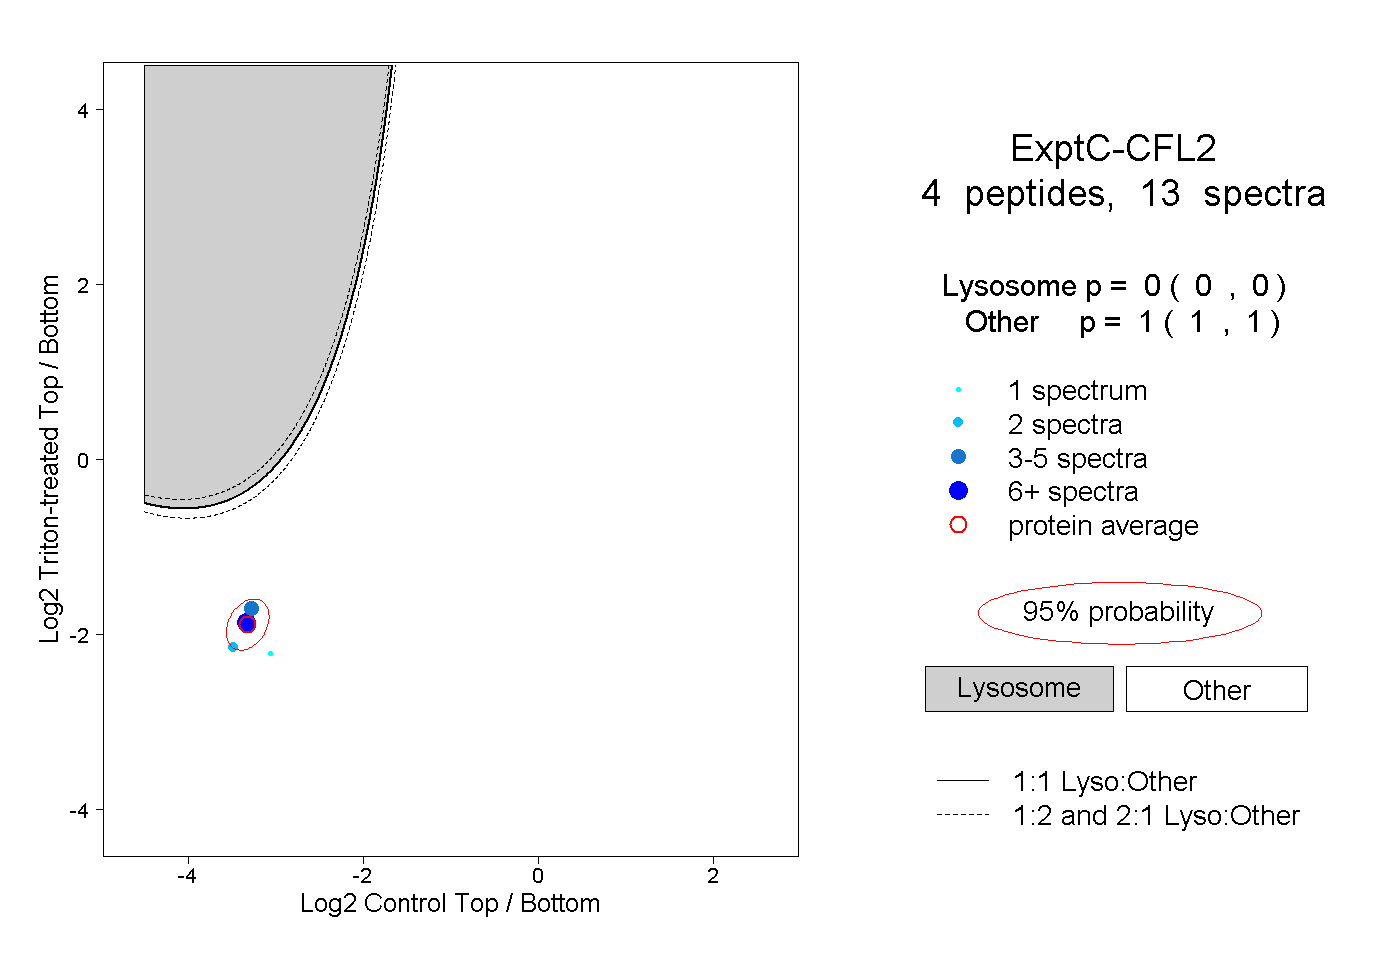 |
0.000 0.000 | 0.000 |
1.000 1.000 | 1.000 |
||||||||
| Plot | Lyso | Other | |||||||||||
| Expt D |
1 peptide |
1 spectrum |
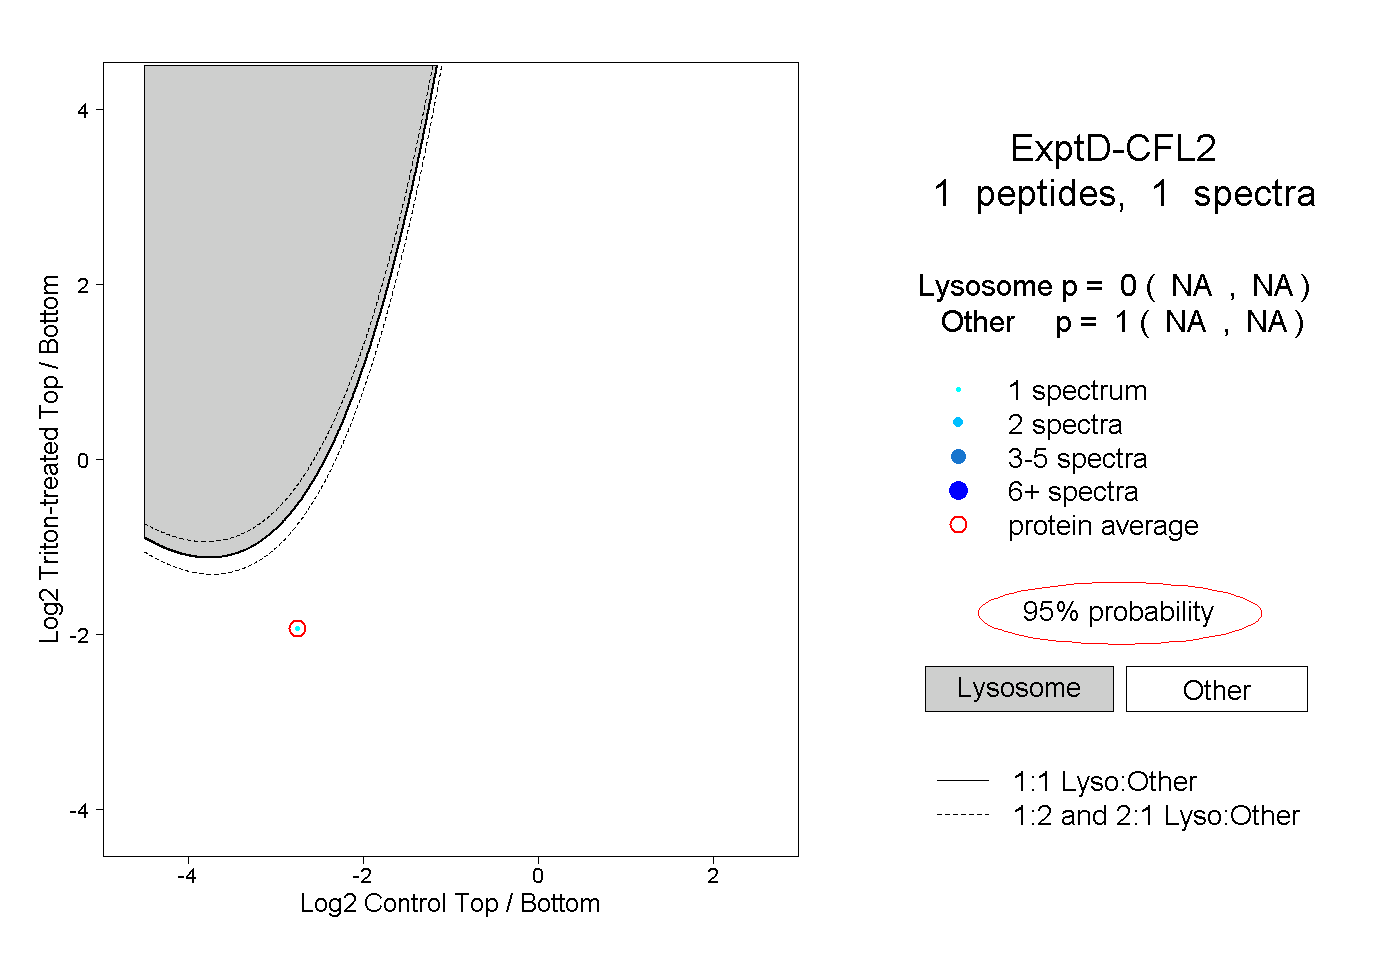 |
0.000 NA | NA |
1.000 NA | NA |