 6
6peptides
spectra
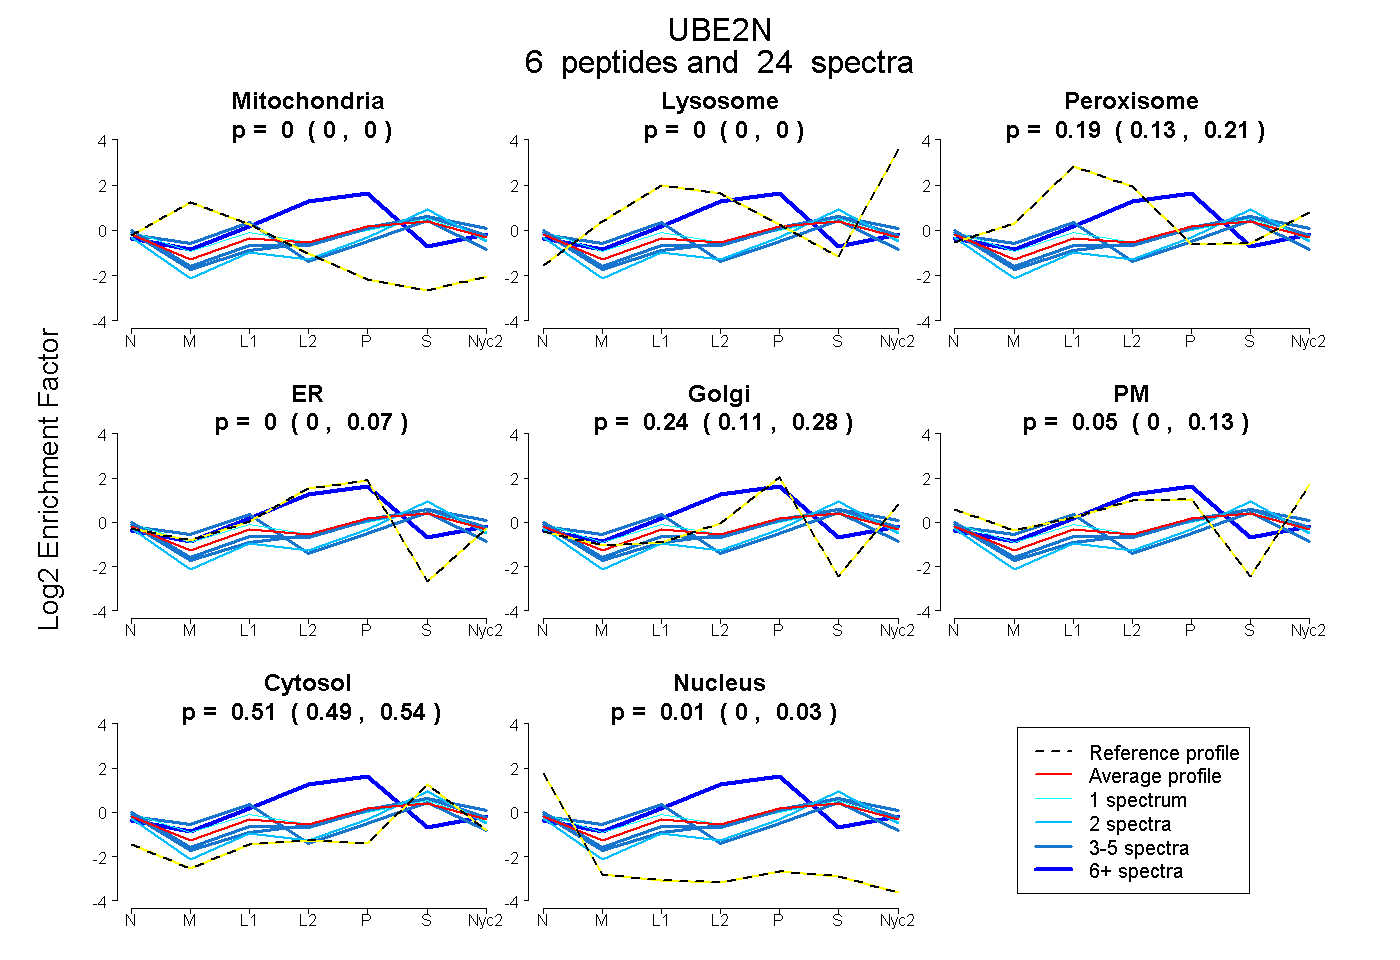
0.000 | 0.000
0.000 | 0.000
0.133 | 0.210
0.000 | 0.070
0.108 | 0.285
0.000 | 0.126
0.486 | 0.543
0.000 | 0.026
1peptide
spectra
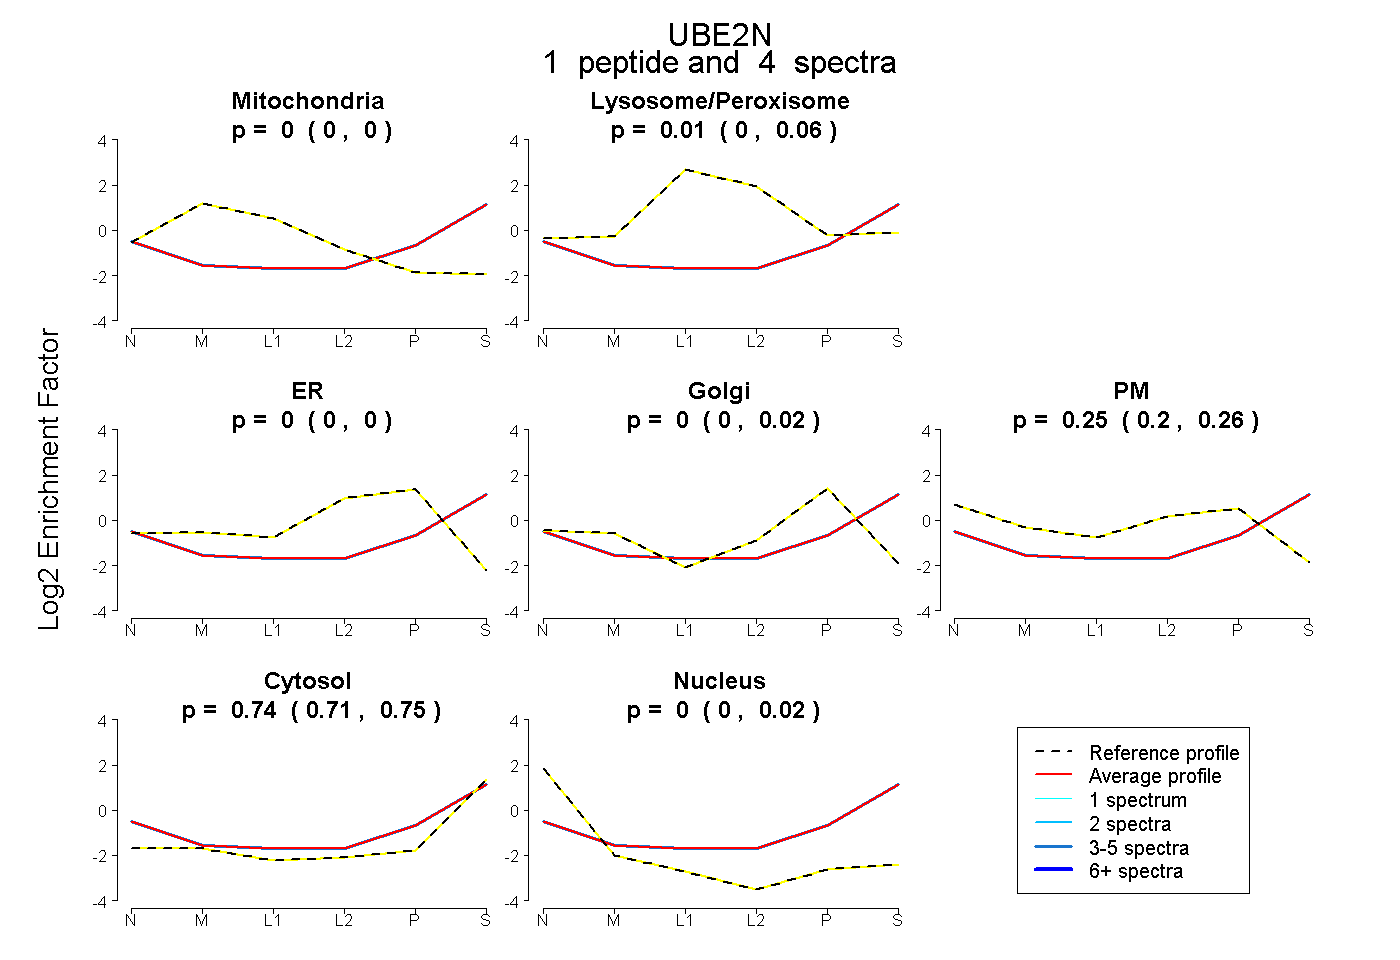
0.000 | 0.000
0.000 | 0.058
0.000 | 0.000
0.000 | 0.024
0.197 | 0.263
0.711 | 0.750
0.000 | 0.016
8peptides
spectra
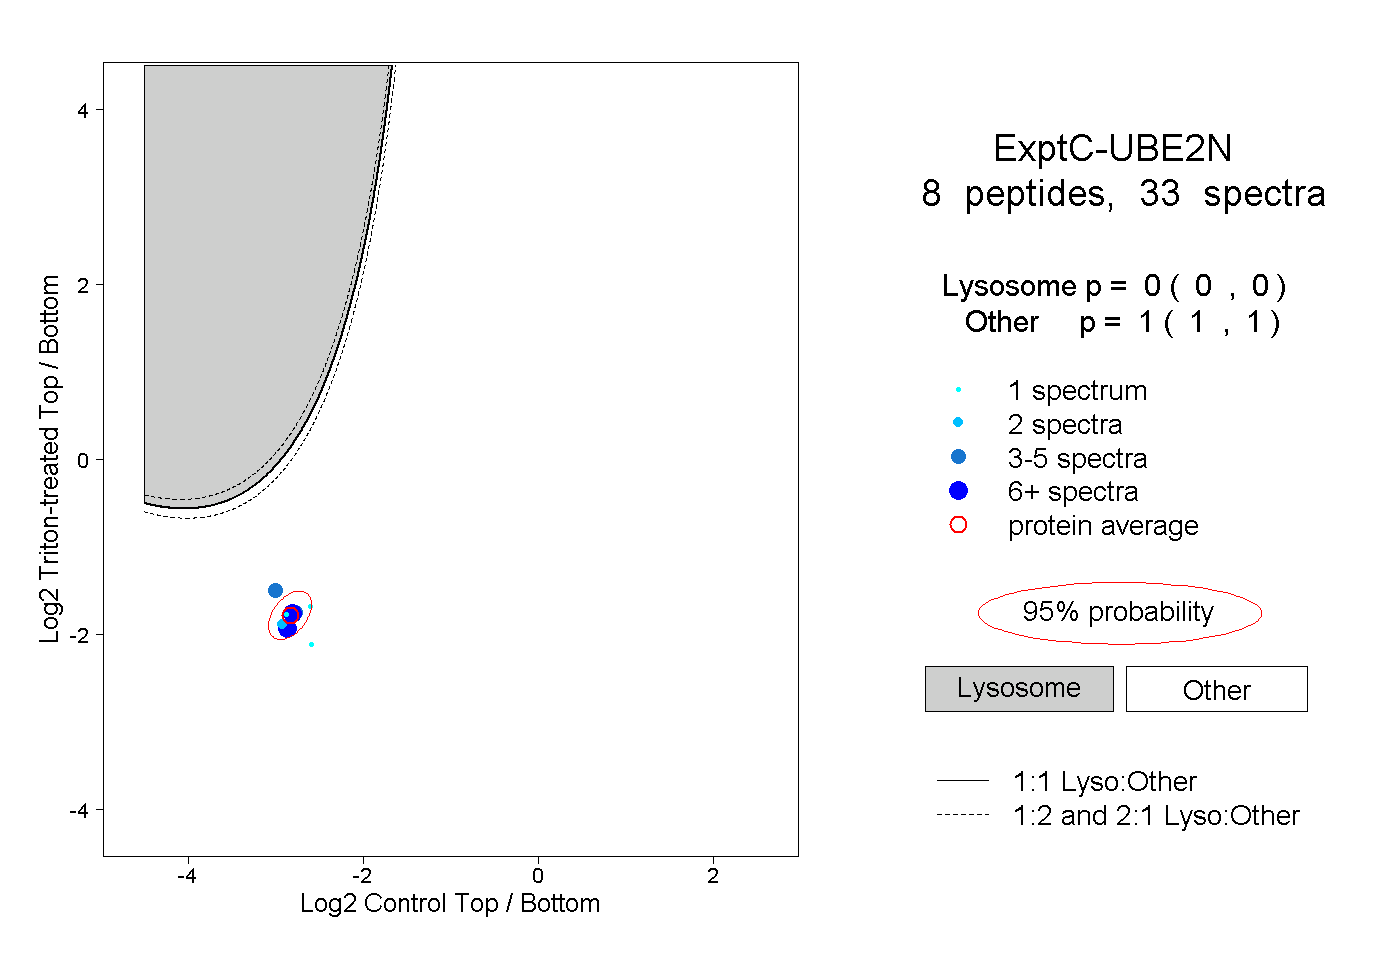
0.000 | 0.000
1.000 | 1.000
3peptides
spectra
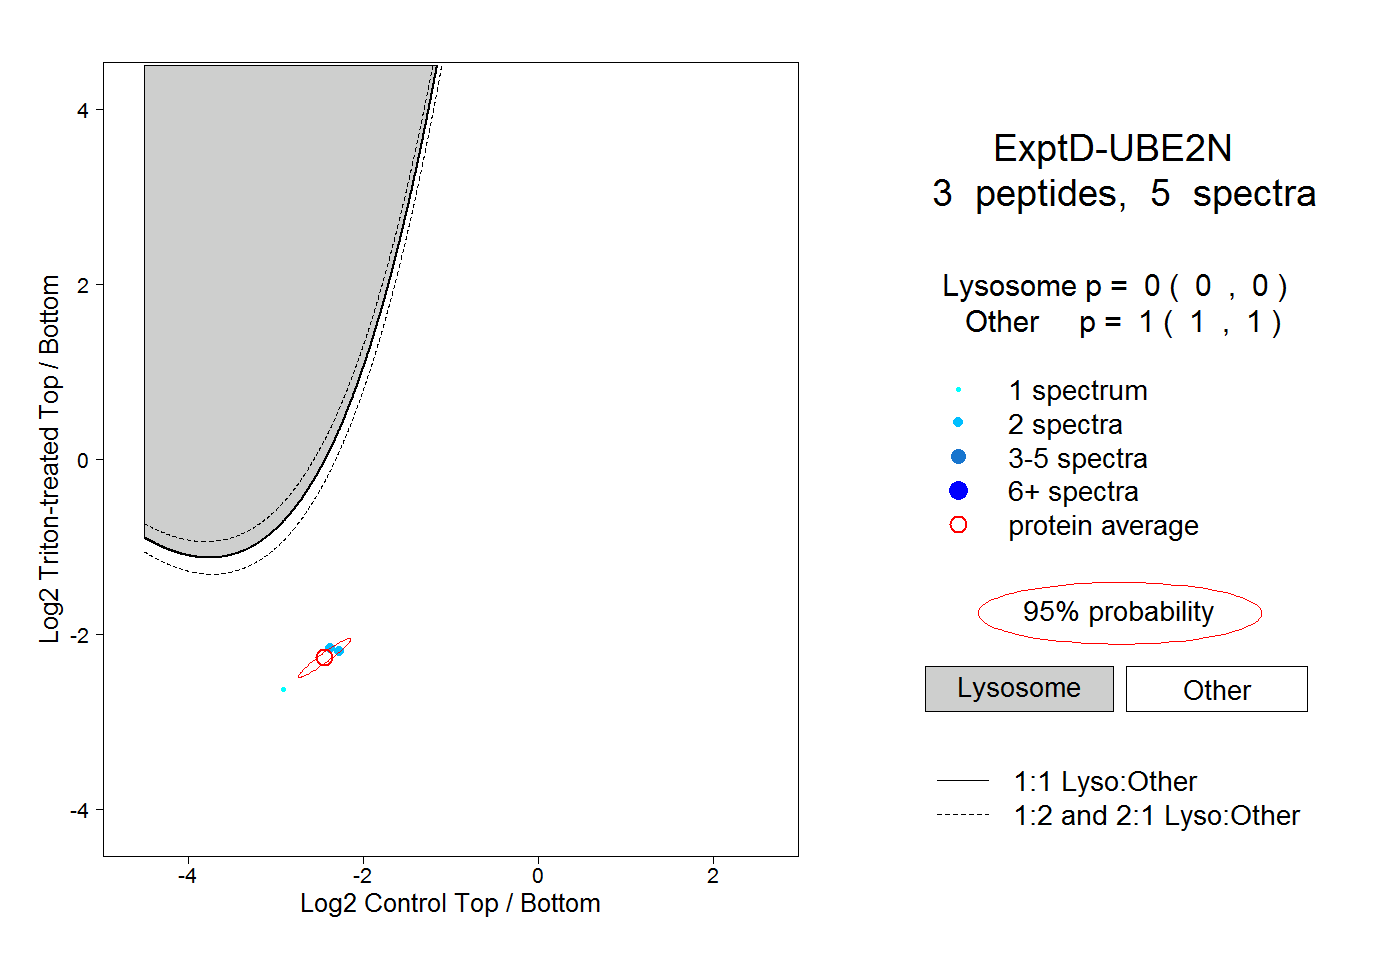
0.000 | 0.000
1.000 | 1.000