 6
6peptides
spectra
0.000 | 0.000
0.000 | 0.000
0.133 | 0.210
0.000 | 0.070
0.108 | 0.285
0.000 | 0.126
0.486 | 0.543
0.000 | 0.026
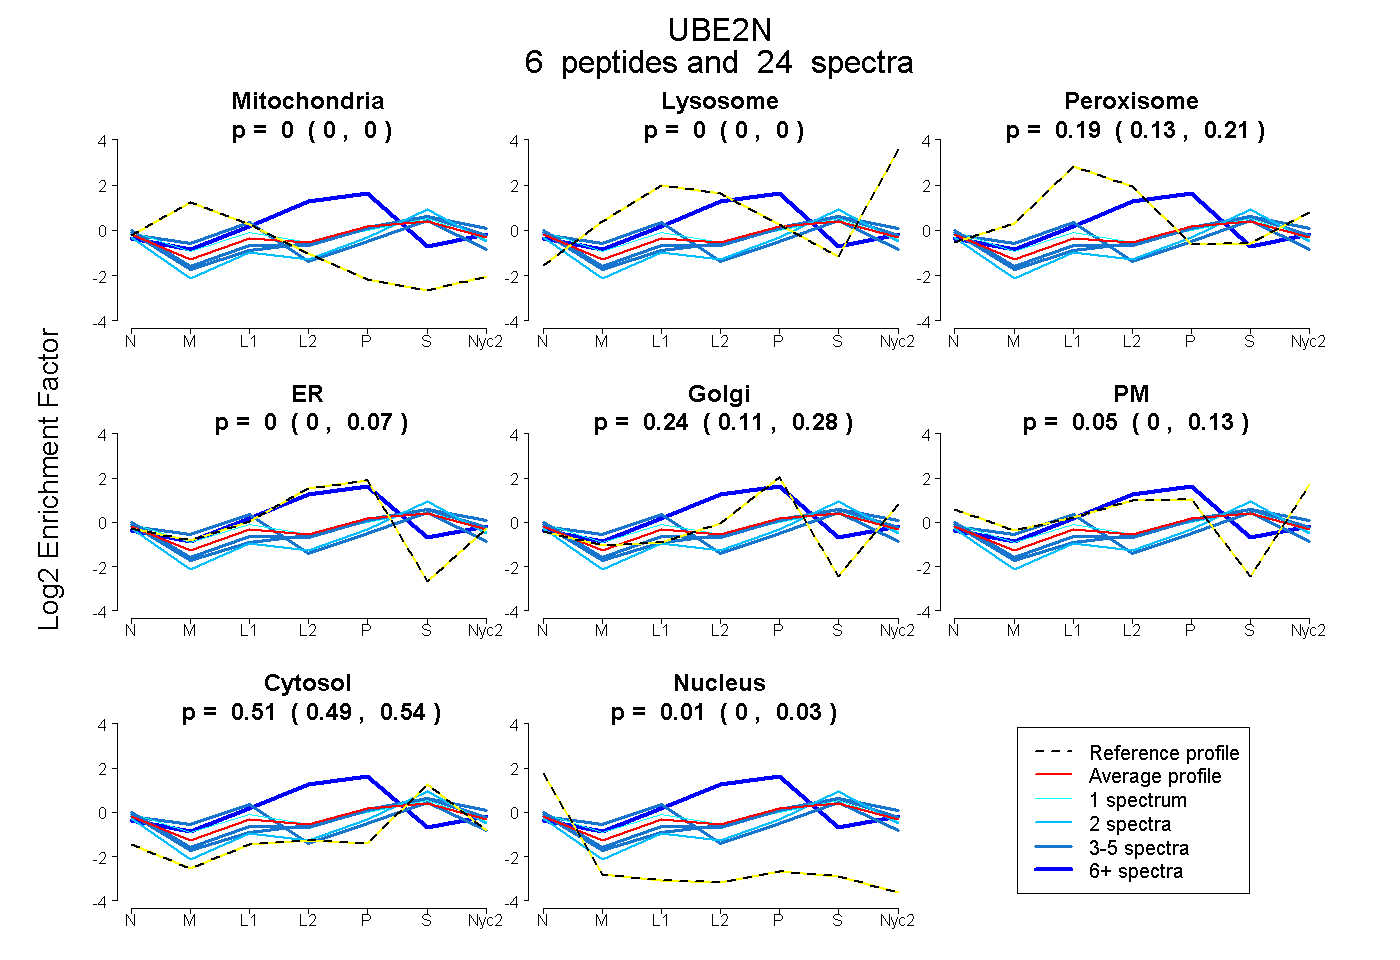
| Plot | Mito | Lyso | Perox | ER | Golgi | PM | Cytosol | Nucleus | |||||
| Expt A |
6 peptides |
24 spectra |
|
0.000 0.000 | 0.000 |
0.000 0.000 | 0.000 |
0.188 0.133 | 0.210 |
0.000 0.000 | 0.070 |
0.239 0.108 | 0.285 |
0.049 0.000 | 0.126 |
0.511 0.486 | 0.543 |
0.014 0.000 | 0.026 |
| 5 spectra, IYHPNVDK | 0.000 | 0.000 | 0.000 | 0.000 | 0.048 | 0.318 | 0.634 | 0.000 | ||
| 2 spectra, WSPALQIR | 0.000 | 0.000 | 0.000 | 0.000 | 0.072 | 0.142 | 0.768 | 0.018 | ||
| 5 spectra, ICLDILK | 0.230 | 0.000 | 0.205 | 0.000 | 0.065 | 0.000 | 0.500 | 0.000 | ||
| 1 spectrum, LLAEPVPGIK | 0.007 | 0.000 | 0.277 | 0.000 | 0.174 | 0.030 | 0.476 | 0.037 | ||
| 6 spectra, AGLPR | 0.000 | 0.008 | 0.153 | 0.645 | 0.000 | 0.000 | 0.194 | 0.000 | ||
| 5 spectra, SNEAQAIETAR | 0.000 | 0.000 | 0.030 | 0.000 | 0.053 | 0.284 | 0.633 | 0.000 |
| Plot | Mito | Lyso or Perox | ER | Golgi | PM | Cytosol | Nucleus | ||||||
| Expt B |
1 peptide |
4 spectra |
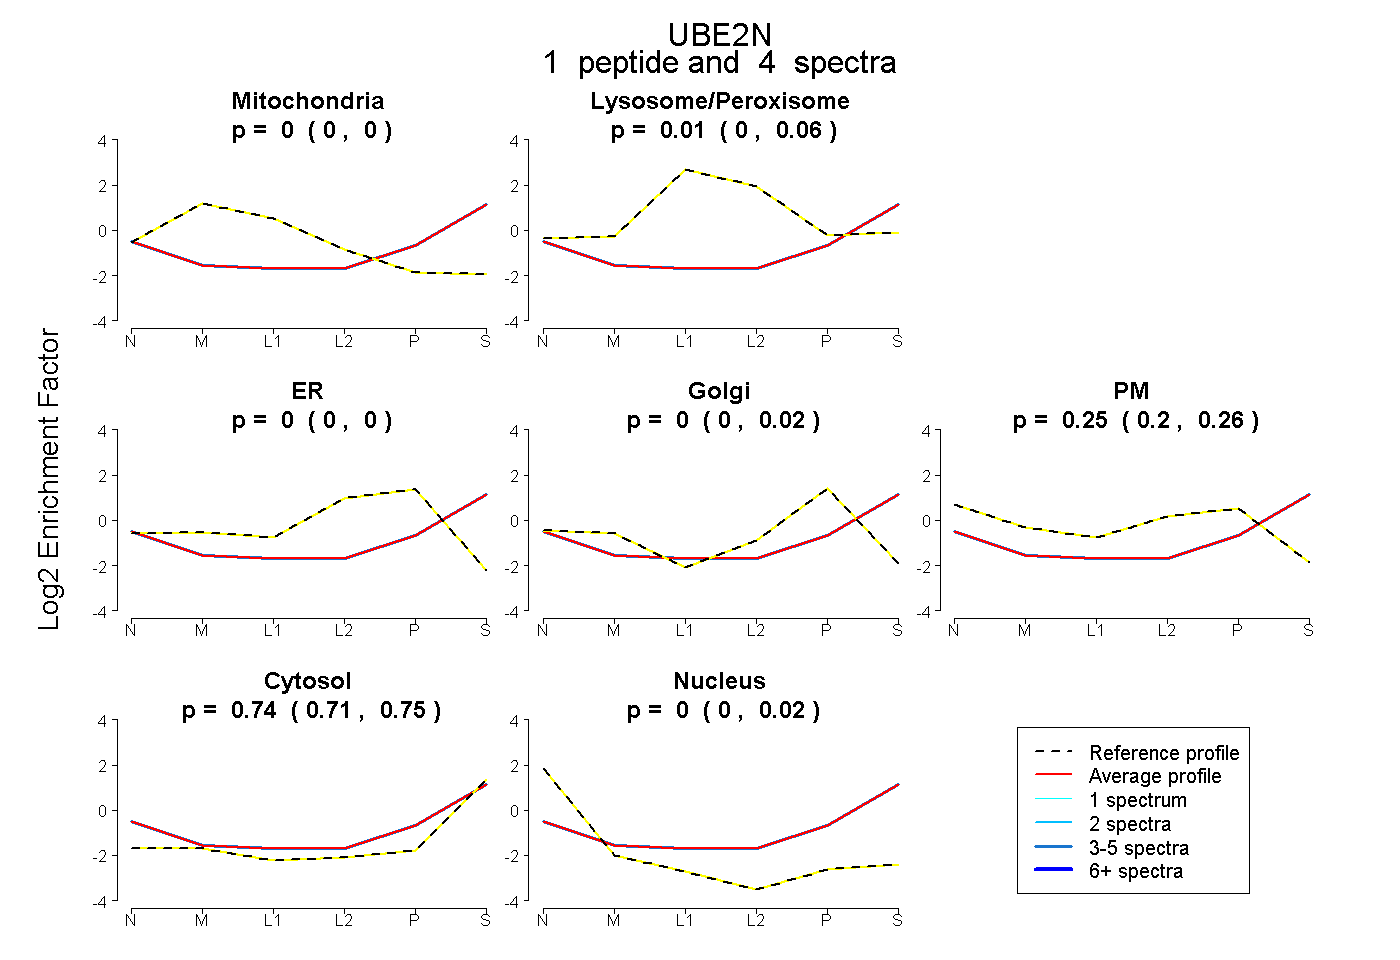 |
0.000 0.000 | 0.000 |
0.015 0.000 | 0.058 |
0.000 0.000 | 0.000 |
0.000 0.000 | 0.024 |
0.250 0.197 | 0.263 |
0.735 0.711 | 0.750 |
0.000 0.000 | 0.016 |
|||
| Plot | Lyso | Other | |||||||||||
| Expt C |
8 peptides |
33 spectra |
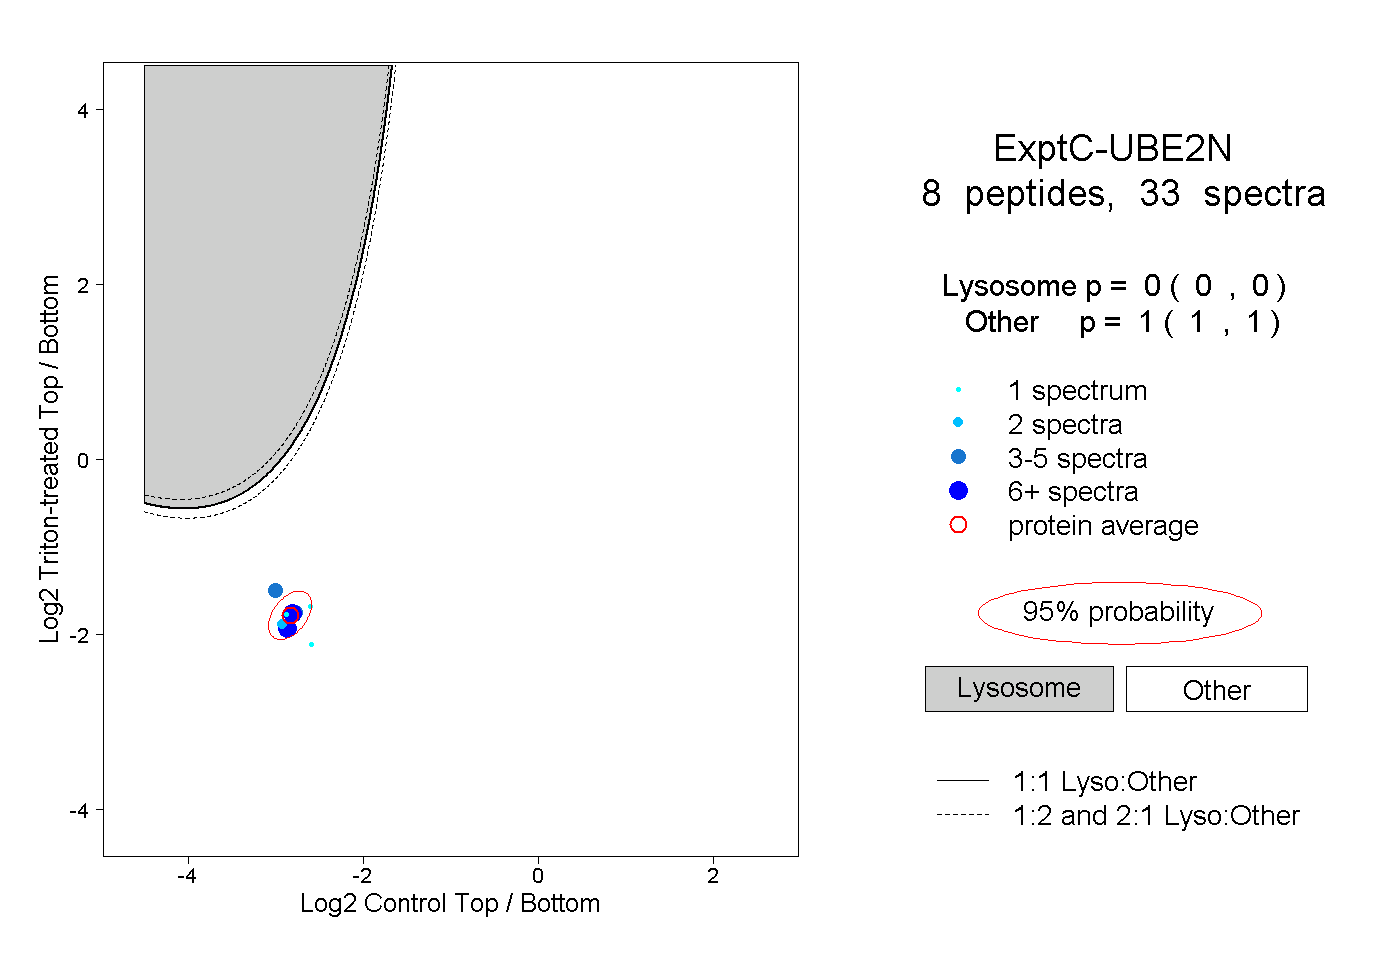 |
0.000 0.000 | 0.000 |
1.000 1.000 | 1.000 |
||||||||
| Plot | Lyso | Other | |||||||||||
| Expt D |
3 peptides |
5 spectra |
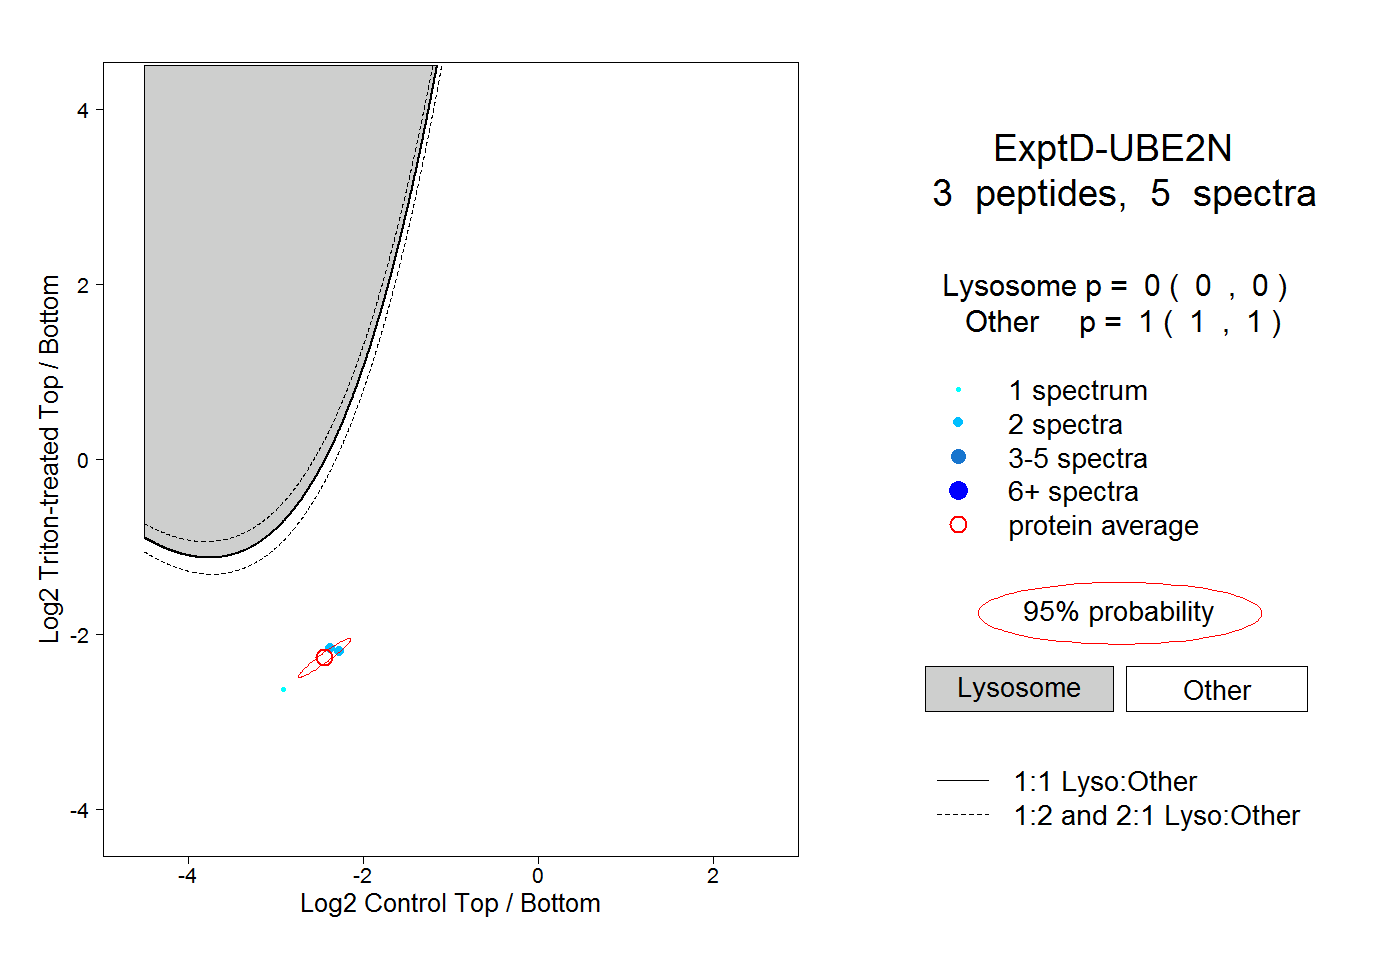 |
0.000 0.000 | 0.000 |
1.000 1.000 | 1.000 |