 1
1peptide
spectra
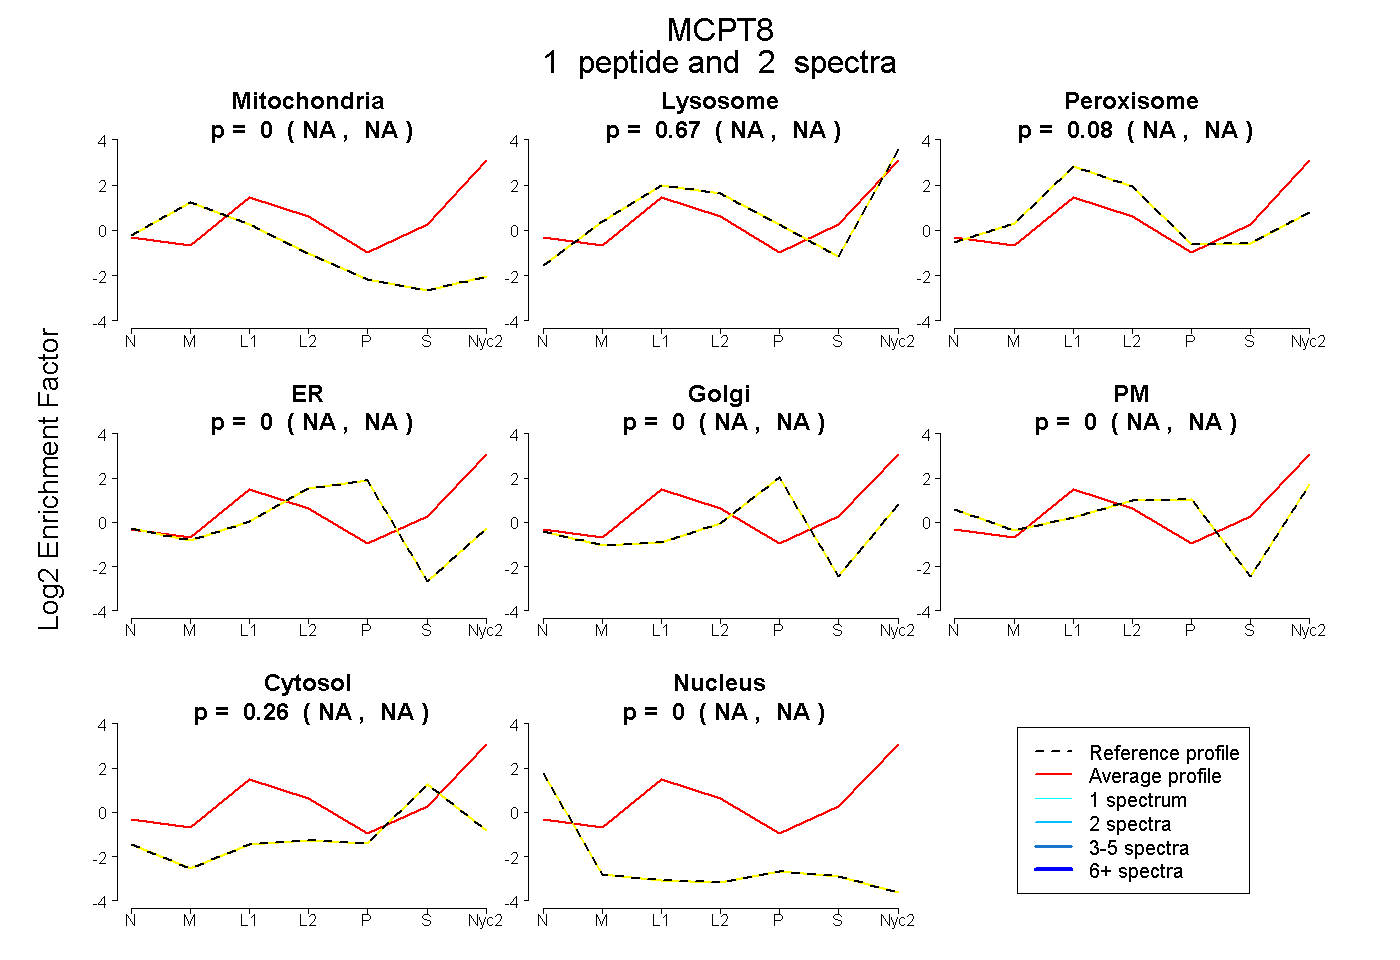
NA | NA
NA | NA
NA | NA
NA | NA
NA | NA
NA | NA
NA | NA
NA | NA
3peptides
spectra
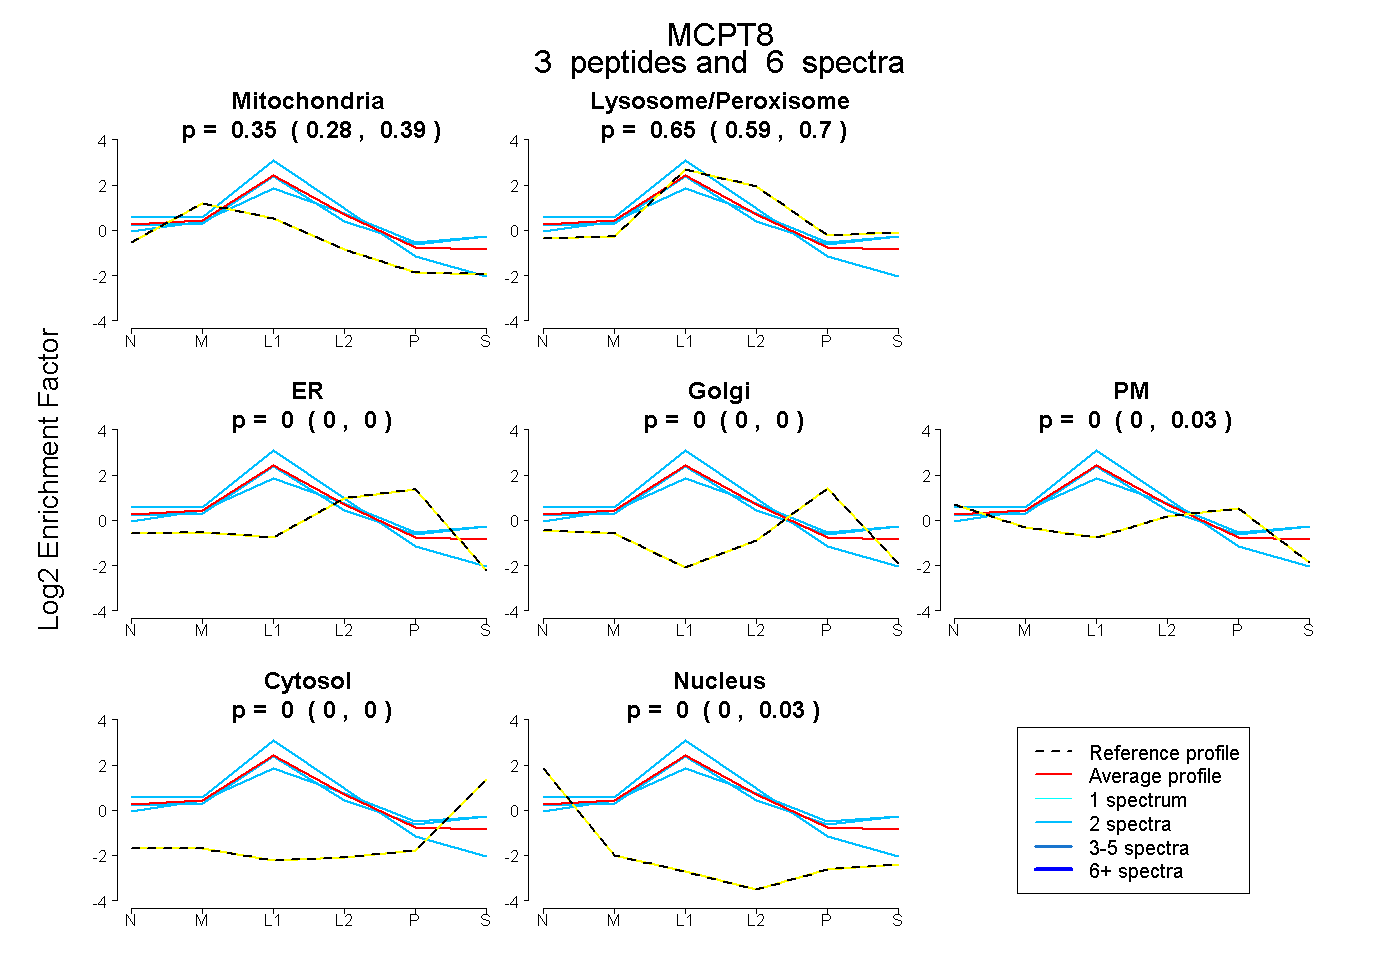
0.281 | 0.390
0.589 | 0.696
0.000 | 0.000
0.000 | 0.000
0.000 | 0.026
0.000 | 0.000
0.000 | 0.026
2peptides
spectra
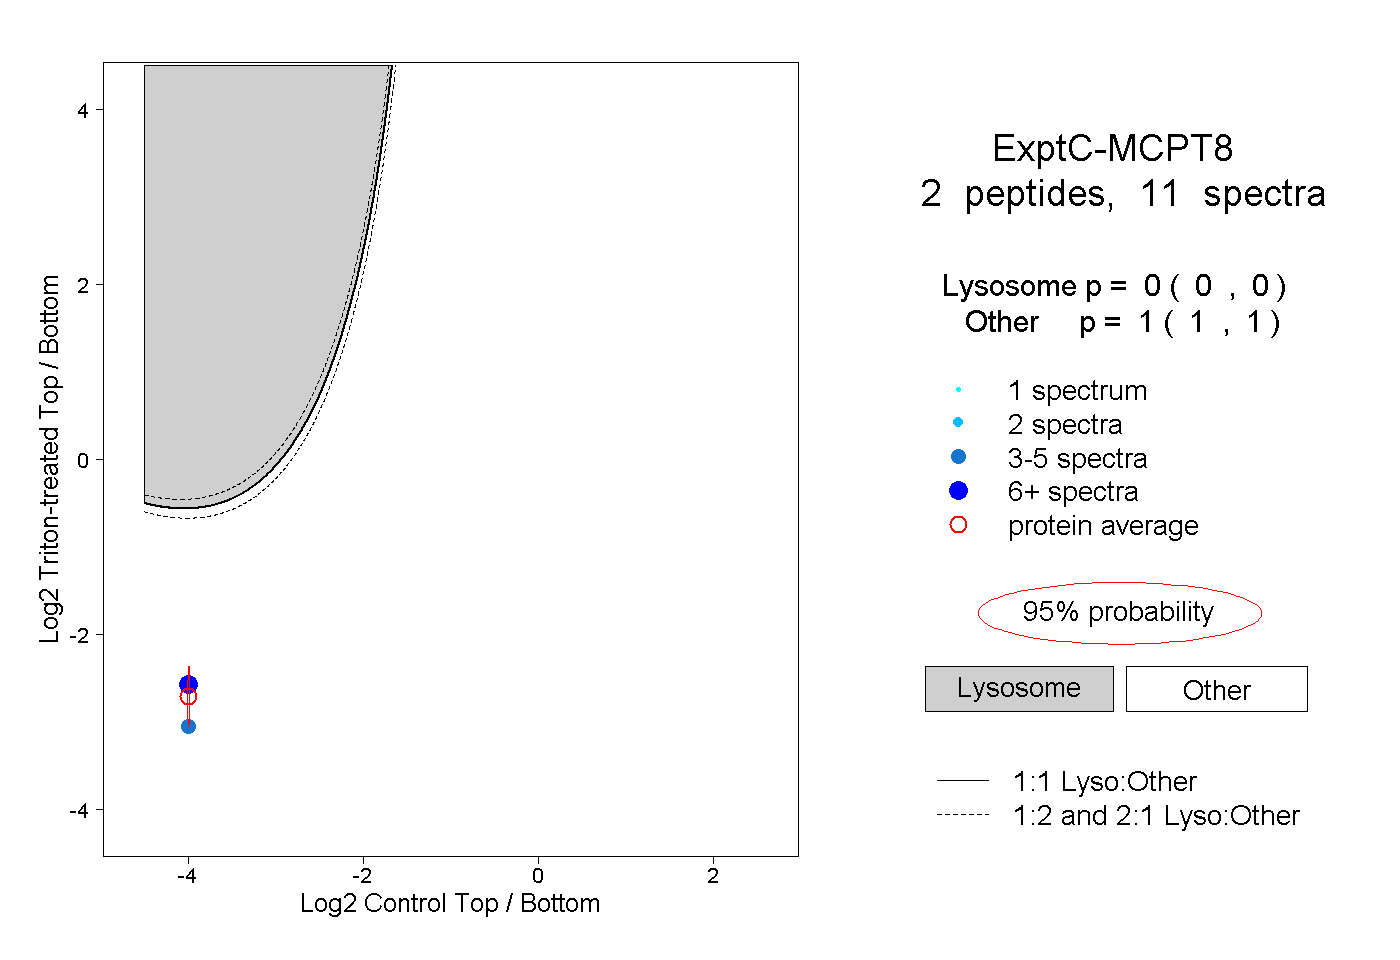
0.000 | 0.000
1.000 | 1.000
3peptides
spectra
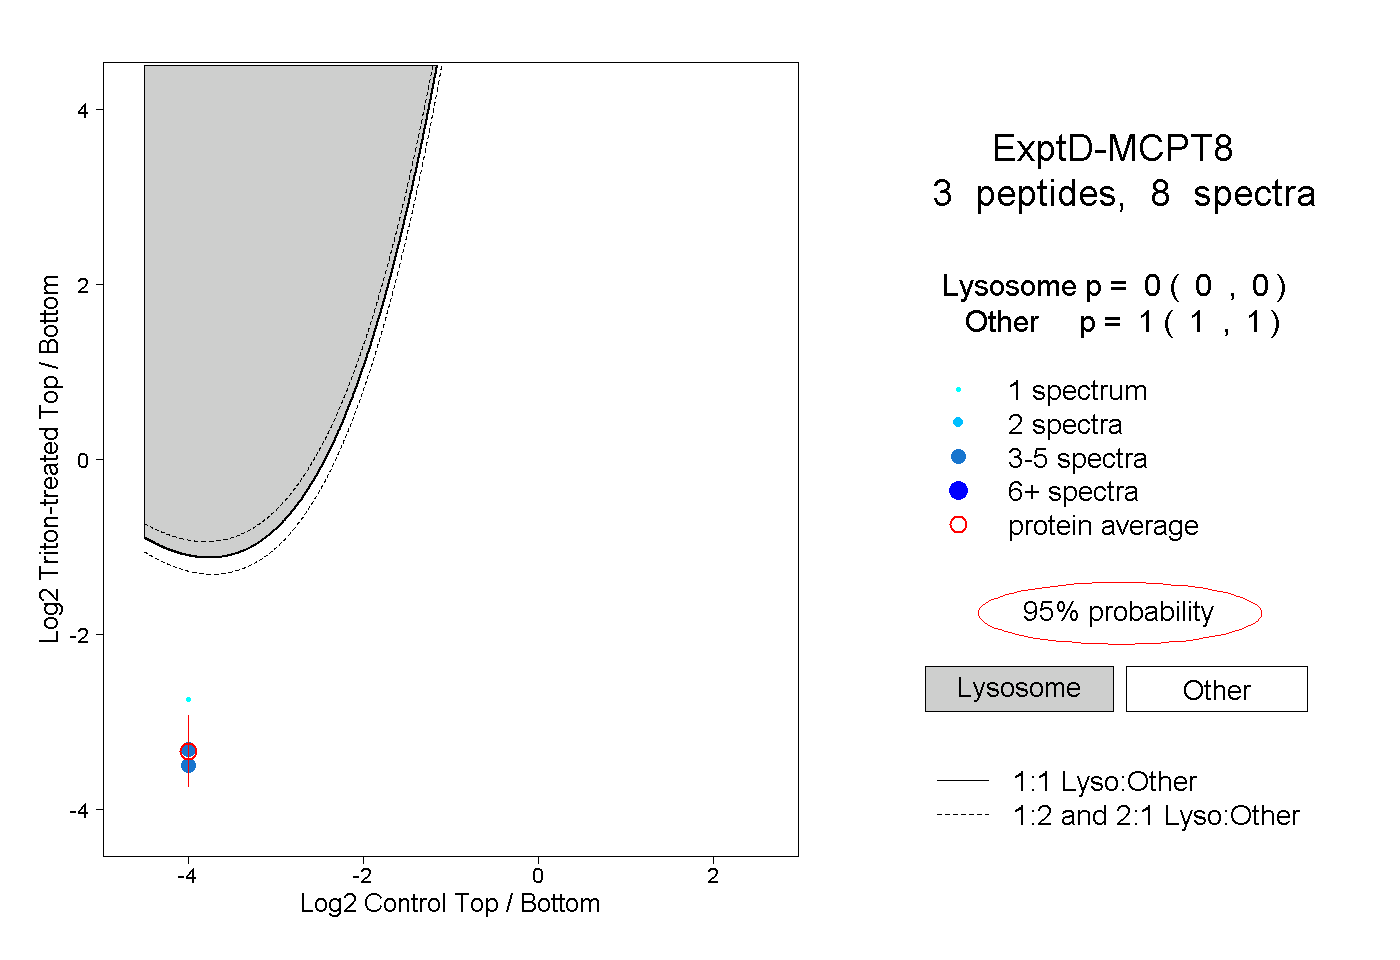
0.000 | 0.000
1.000 | 1.000