 1
1peptide
spectra
NA | NA
NA | NA
NA | NA
NA | NA
NA | NA
NA | NA
NA | NA
NA | NA
3peptides
spectra
0.281 | 0.390
0.589 | 0.696
0.000 | 0.000
0.000 | 0.000
0.000 | 0.026
0.000 | 0.000
0.000 | 0.026
| Plot | Mito | Lyso | Perox | ER | Golgi | PM | Cytosol | Nucleus | |||||
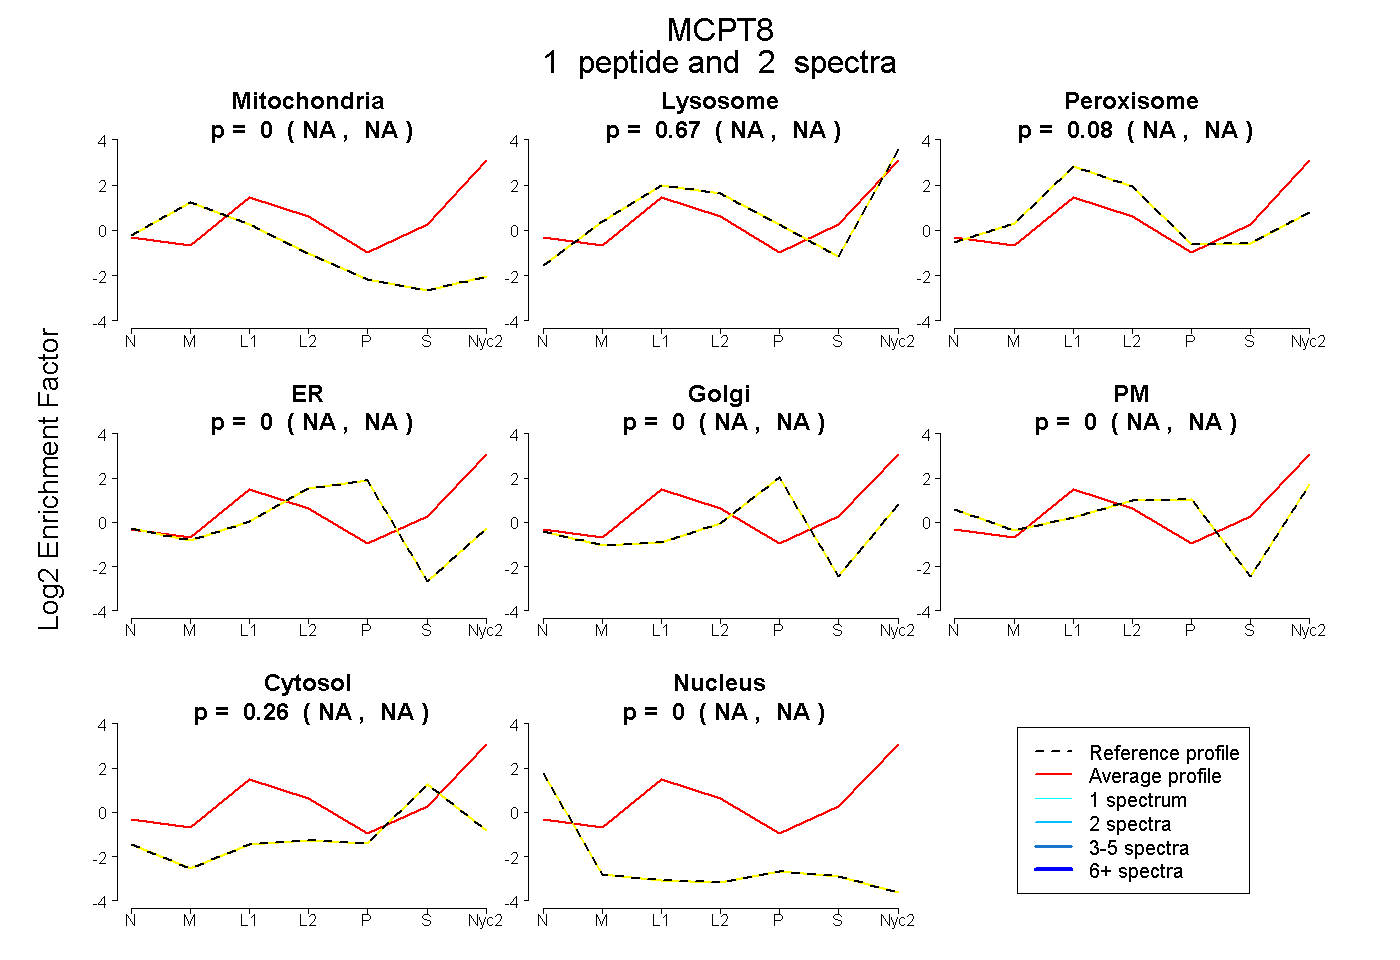
| Expt A |
1 peptide |
2 spectra |
|
0.000 NA | NA |
0.665 NA | NA |
0.078 NA | NA |
0.000 NA | NA |
0.000 NA | NA |
0.000 NA | NA |
0.257 NA | NA |
0.000 NA | NA |
||
| Plot | Mito | Lyso or Perox | ER | Golgi | PM | Cytosol | Nucleus | ||||||
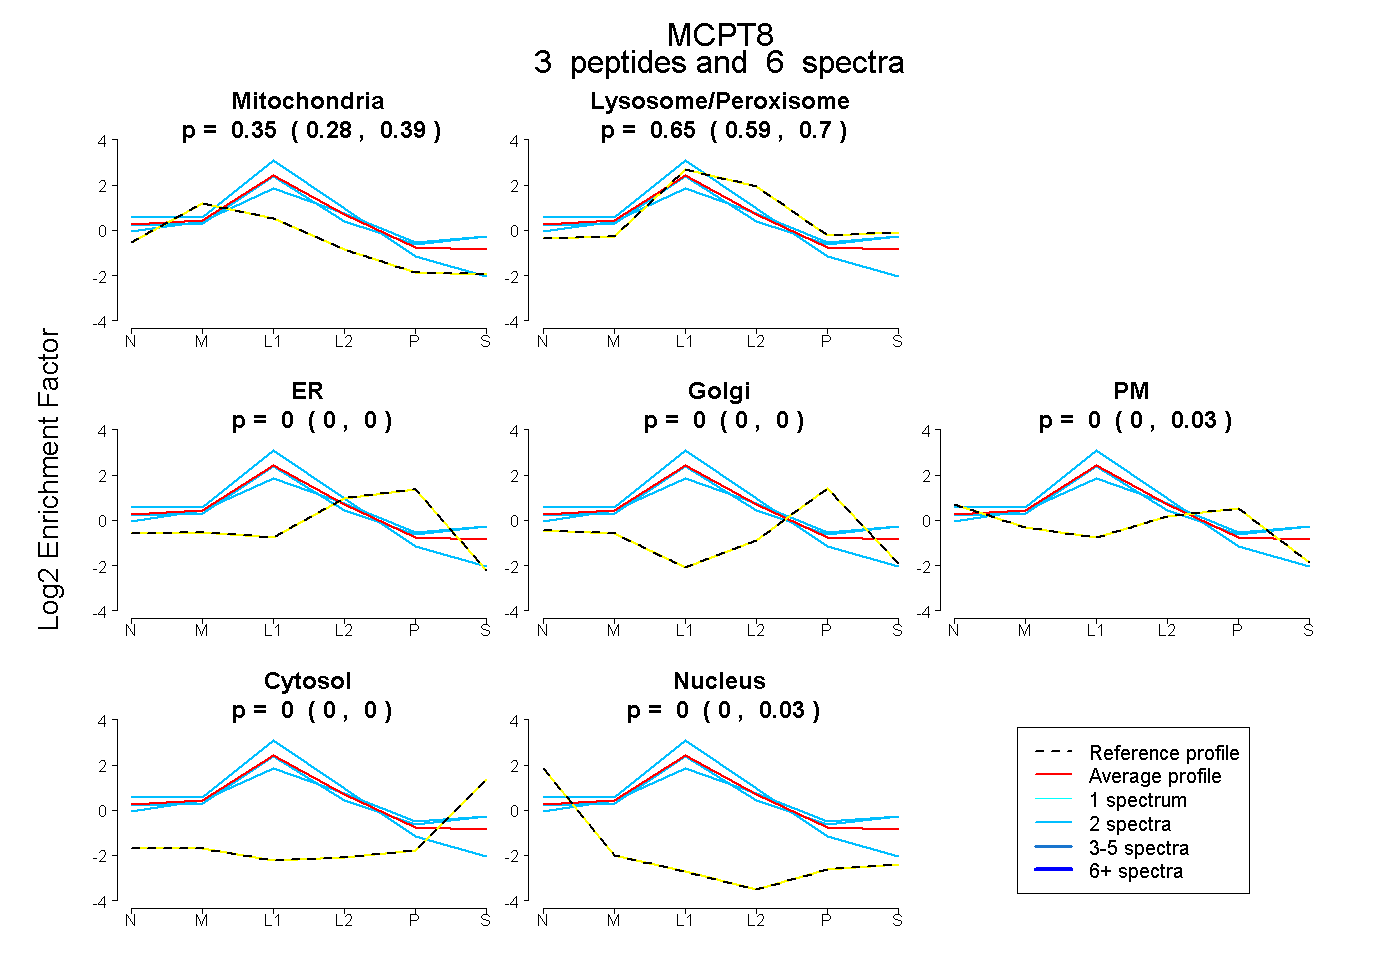
| Expt B |
3 peptides |
6 spectra |
|
0.349 0.281 | 0.390 |
0.649 0.589 | 0.696 |
0.000 0.000 | 0.000 |
0.000 0.000 | 0.000 |
0.000 0.000 | 0.026 |
0.000 0.000 | 0.000 |
0.002 0.000 | 0.026 |
| 2 spectra, LCTGTLPR | 0.392 | 0.608 | 0.000 | 0.000 | 0.000 | 0.000 | 0.000 | |||
| 2 spectra, FNDIMLLK | 0.271 | 0.647 | 0.000 | 0.000 | 0.047 | 0.035 | 0.000 | |||
| 2 spectra, TLALPR | 0.256 | 0.698 | 0.000 | 0.000 | 0.000 | 0.000 | 0.046 |
| Plot | Lyso | Other | |||||||||||
| Expt C |
2 peptides |
11 spectra |
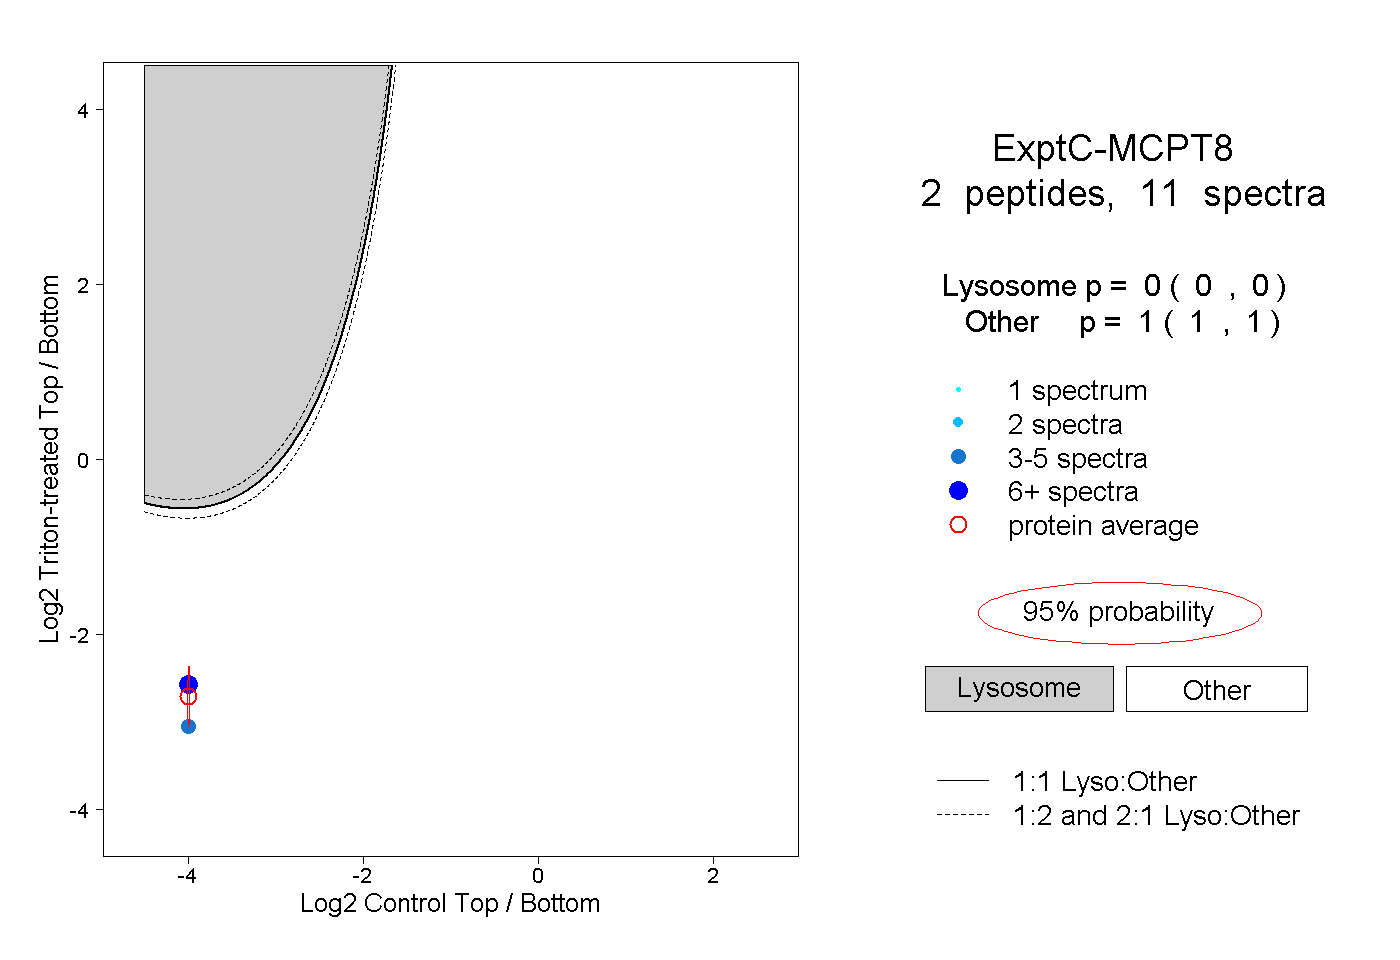 |
0.000 0.000 | 0.000 |
1.000 1.000 | 1.000 |
||||||||
| Plot | Lyso | Other | |||||||||||
| Expt D |
3 peptides |
8 spectra |
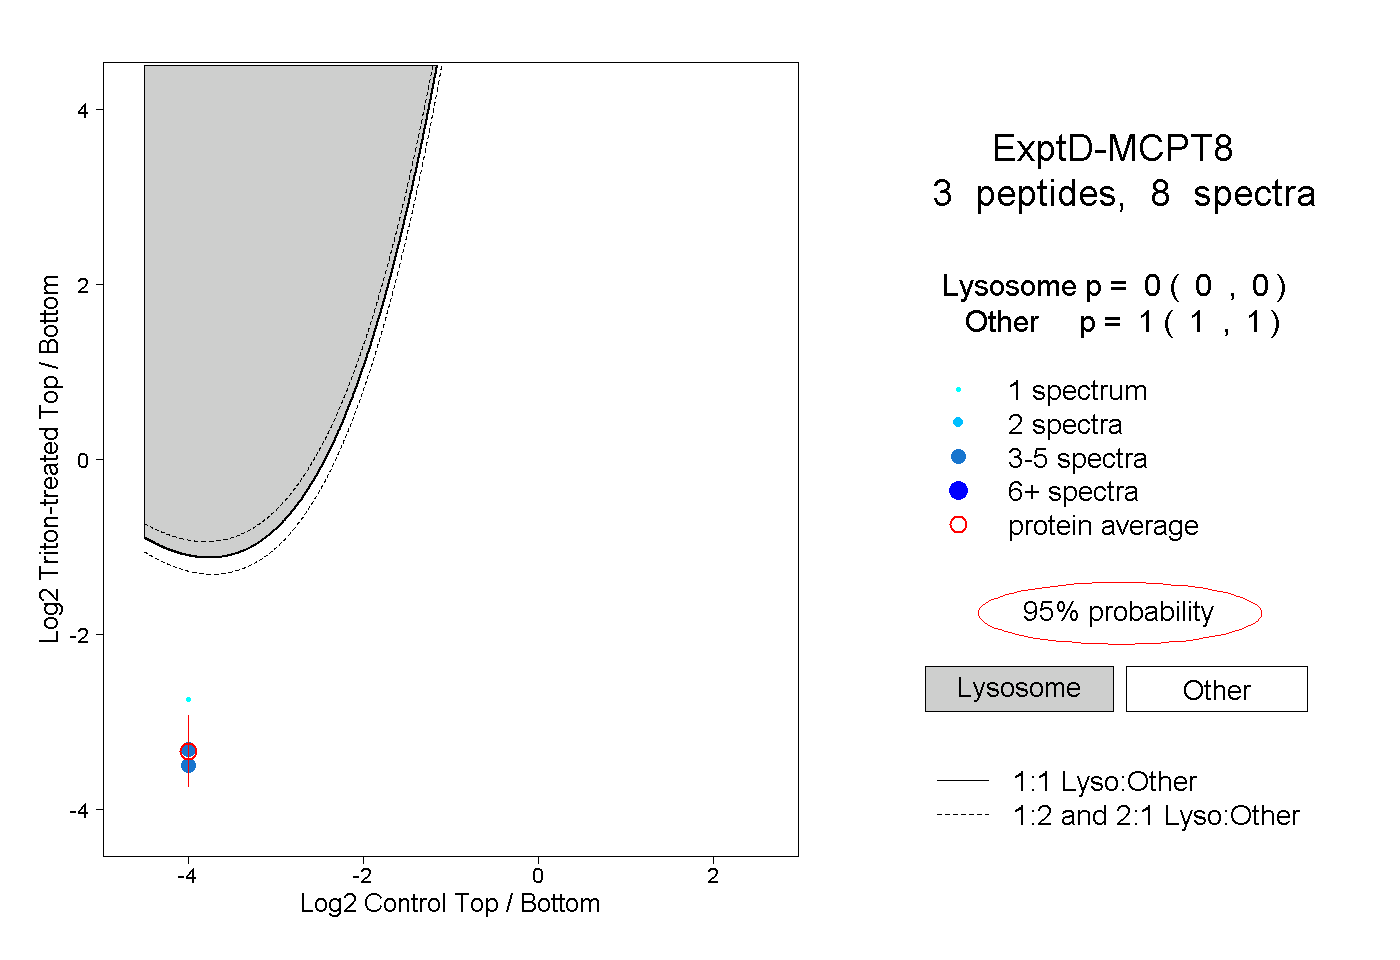 |
0.000 0.000 | 0.000 |
1.000 1.000 | 1.000 |