 7
7peptides
spectra
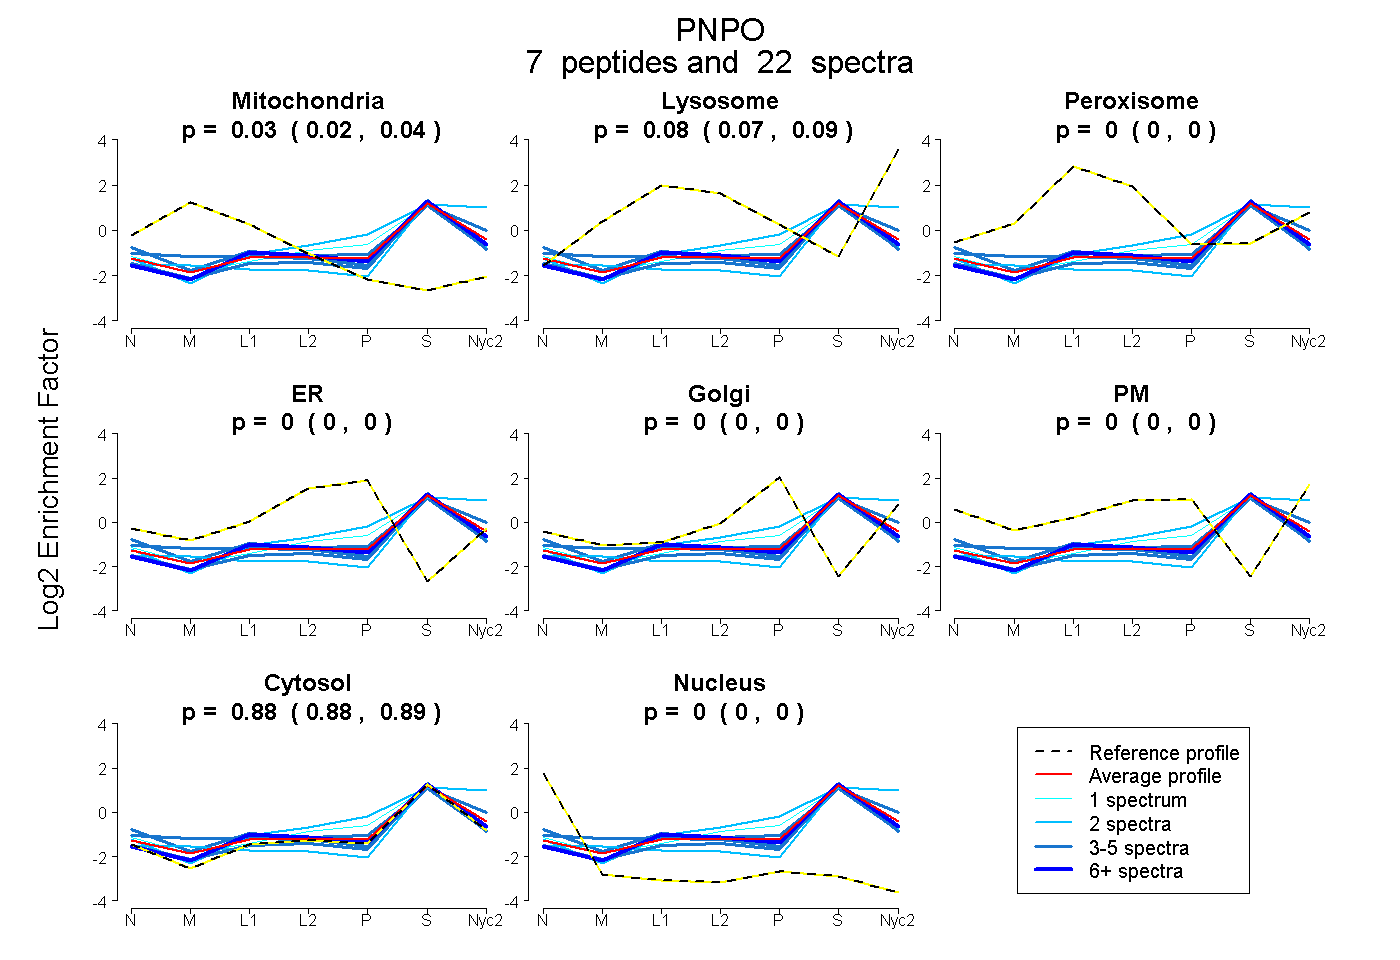
0.019 | 0.043
0.069 | 0.094
0.000 | 0.000
0.000 | 0.000
0.000 | 0.000
0.000 | 0.000
0.876 | 0.893
0.000 | 0.000
5peptides
spectra
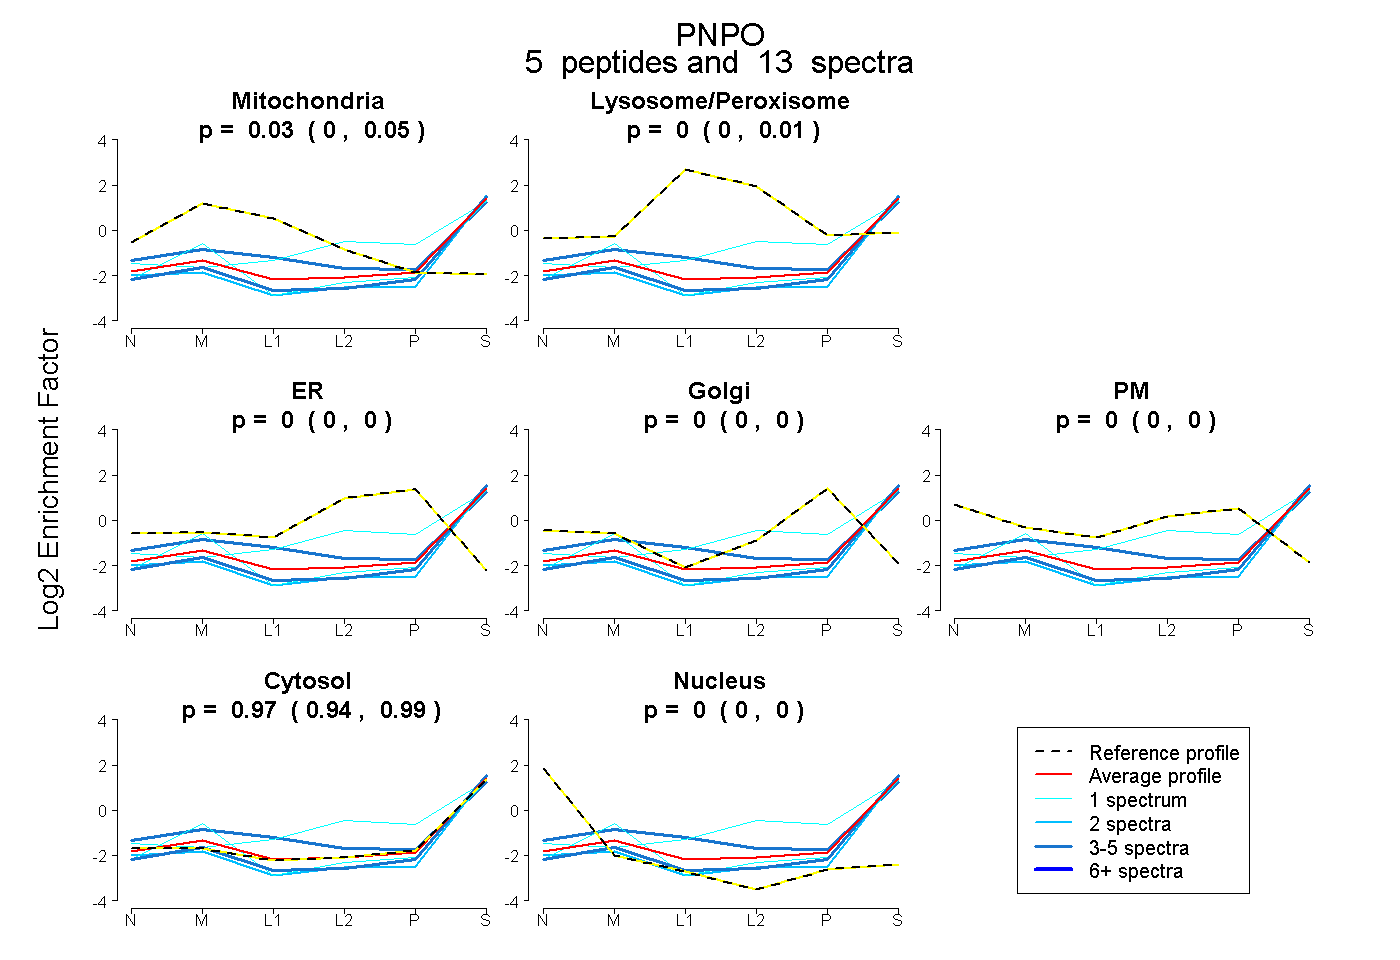
0.003 | 0.051
0.000 | 0.008
0.000 | 0.000
0.000 | 0.000
0.000 | 0.000
0.942 | 0.991
0.000 | 0.000
7peptides
spectra
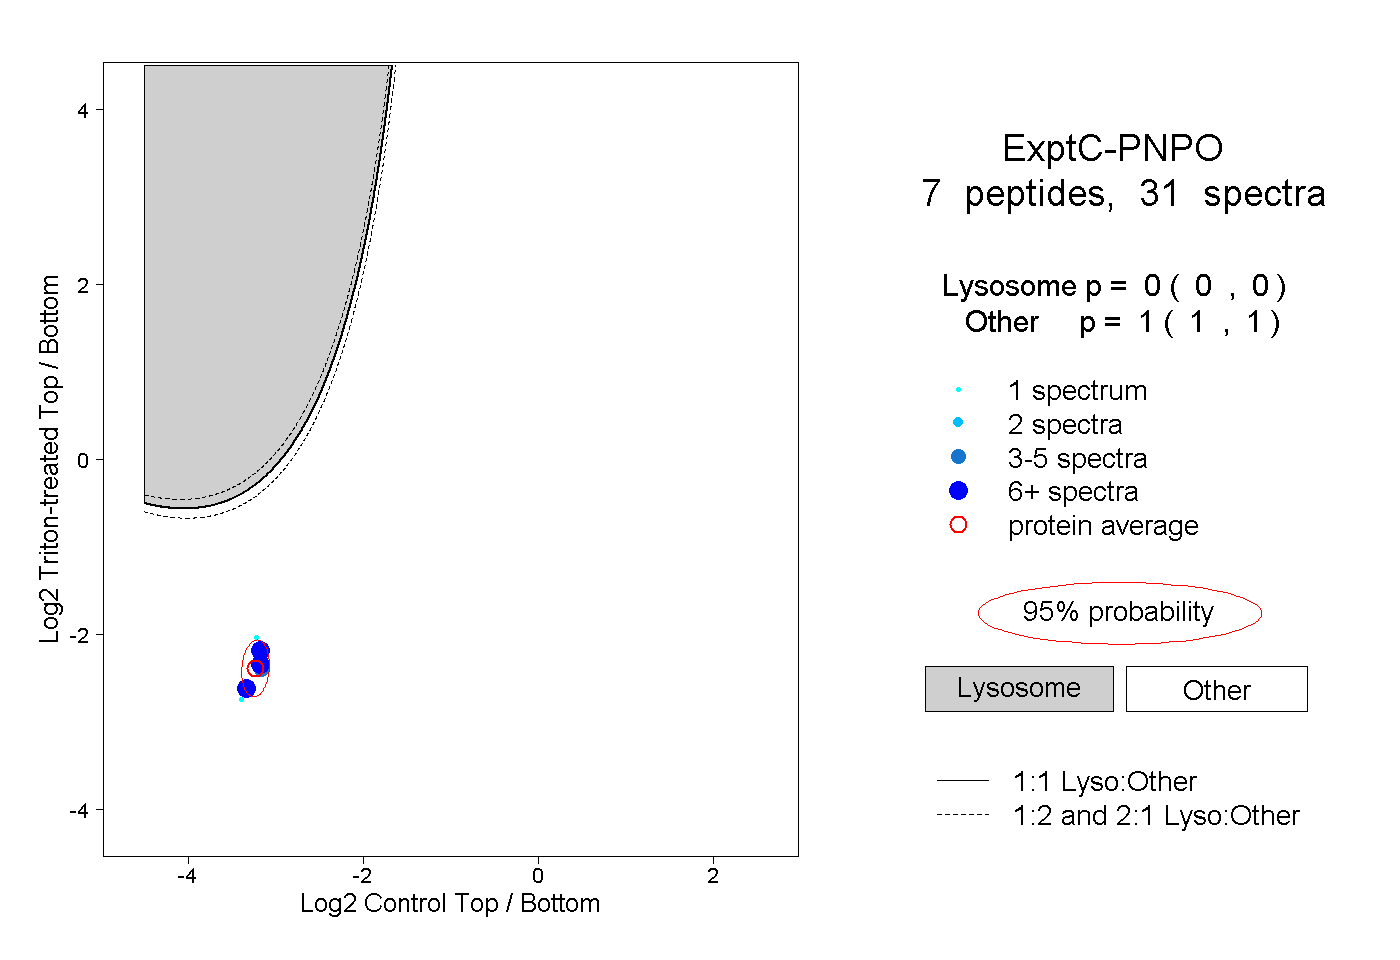
0.000 | 0.000
1.000 | 1.000
3peptides
spectra
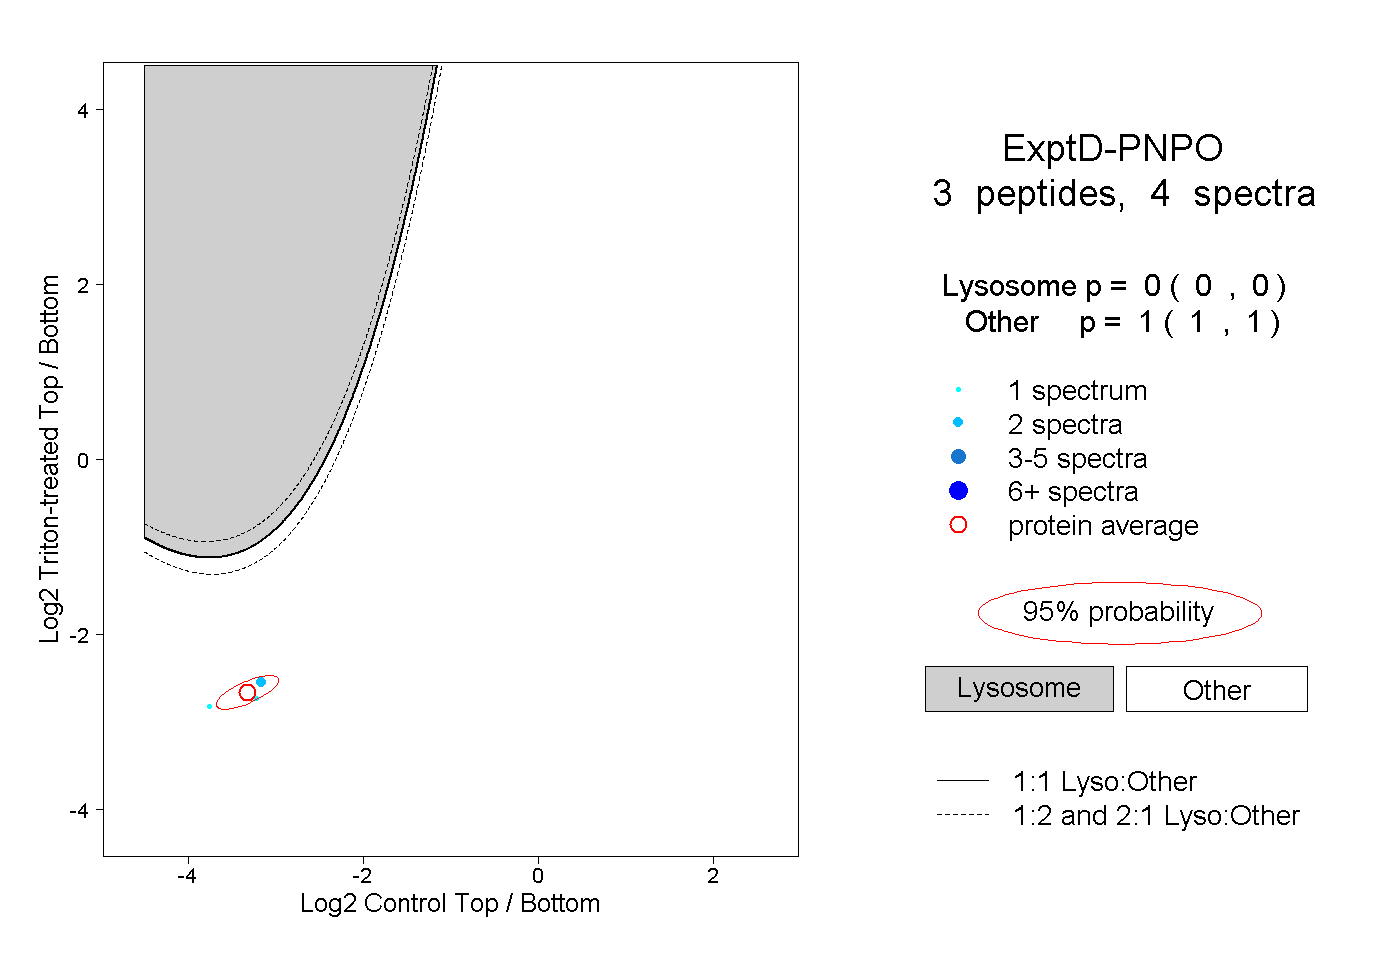
0.000 | 0.000
1.000 | 1.000