 5
5peptides
spectra
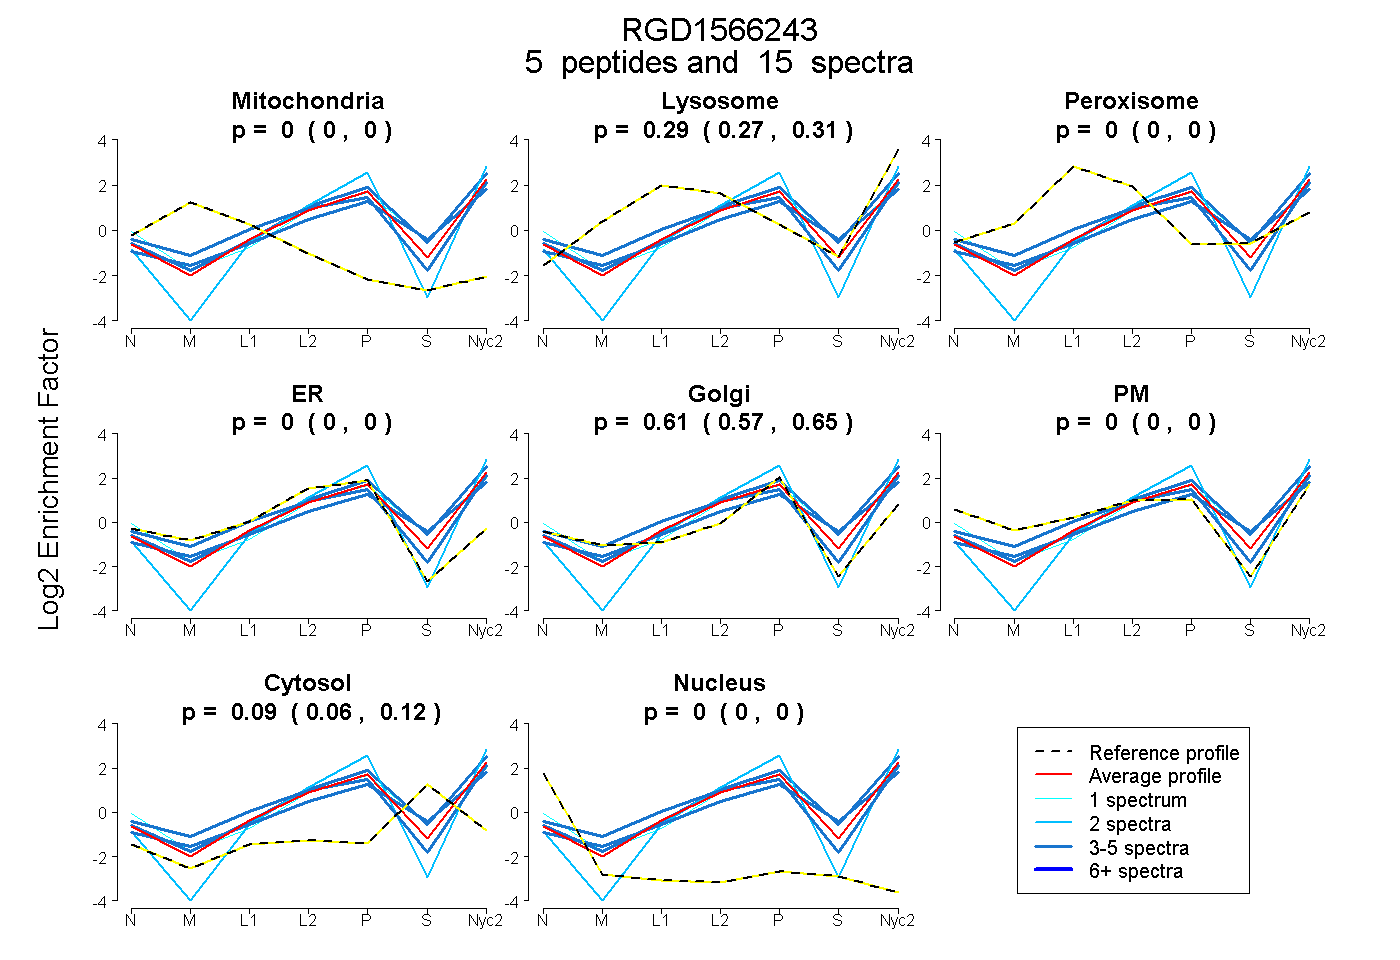
0.000 | 0.000
0.270 | 0.313
0.000 | 0.000
0.000 | 0.000
0.571 | 0.647
0.000 | 0.000
0.063 | 0.122
0.000 | 0.000
3peptides
spectra
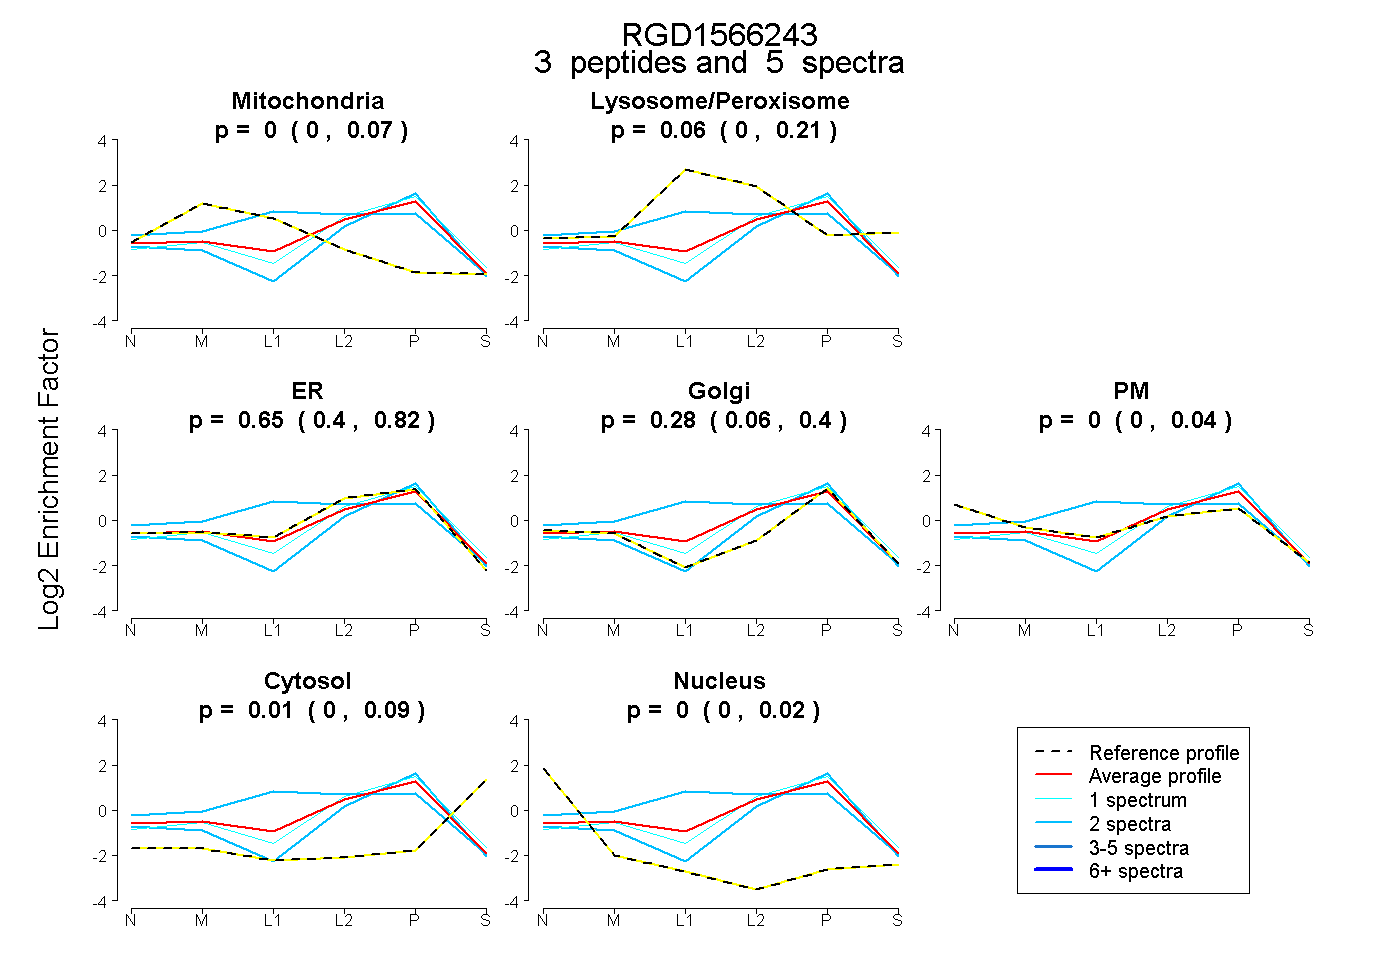
0.000 | 0.066
0.000 | 0.211
0.404 | 0.820
0.065 | 0.397
0.000 | 0.039
0.000 | 0.087
0.000 | 0.021
5peptides
spectra
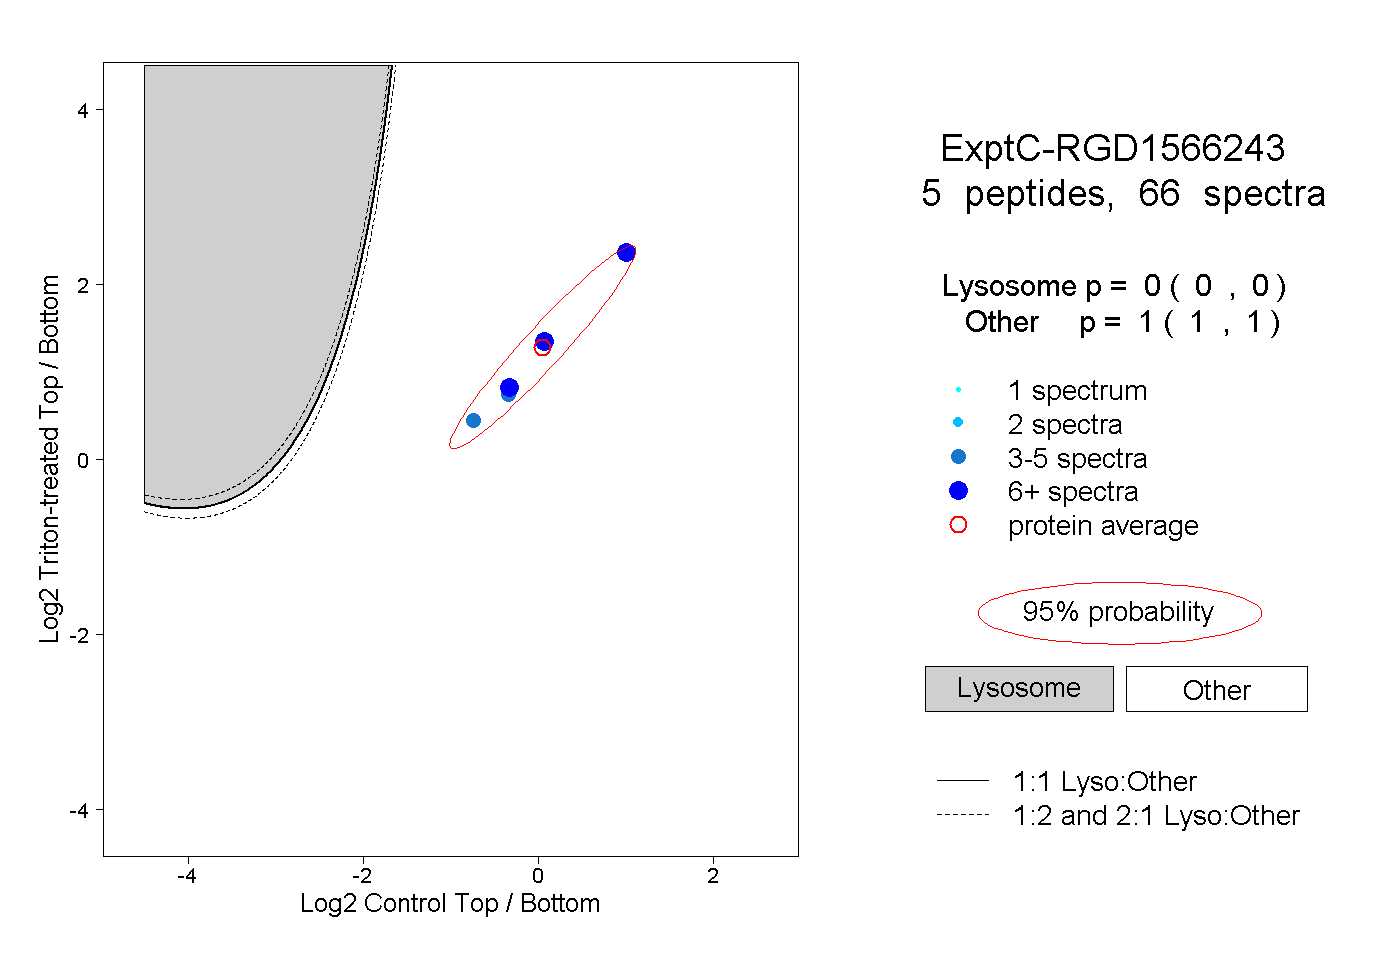
0.000 | 0.000
1.000 | 1.000
2peptides
spectra
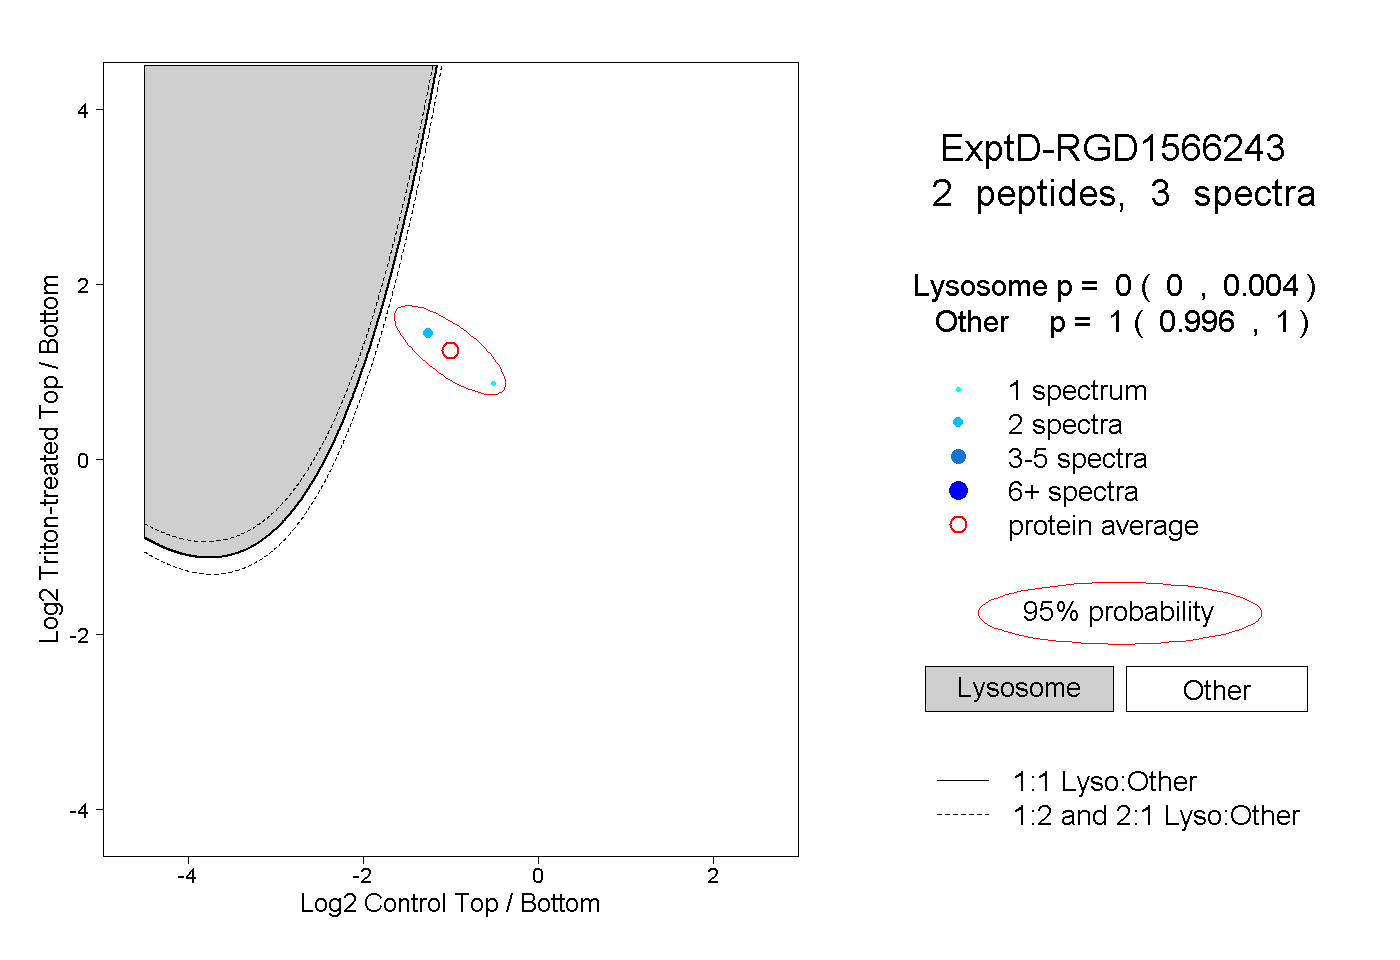
0.000 | 0.004
0.996 | 1.000