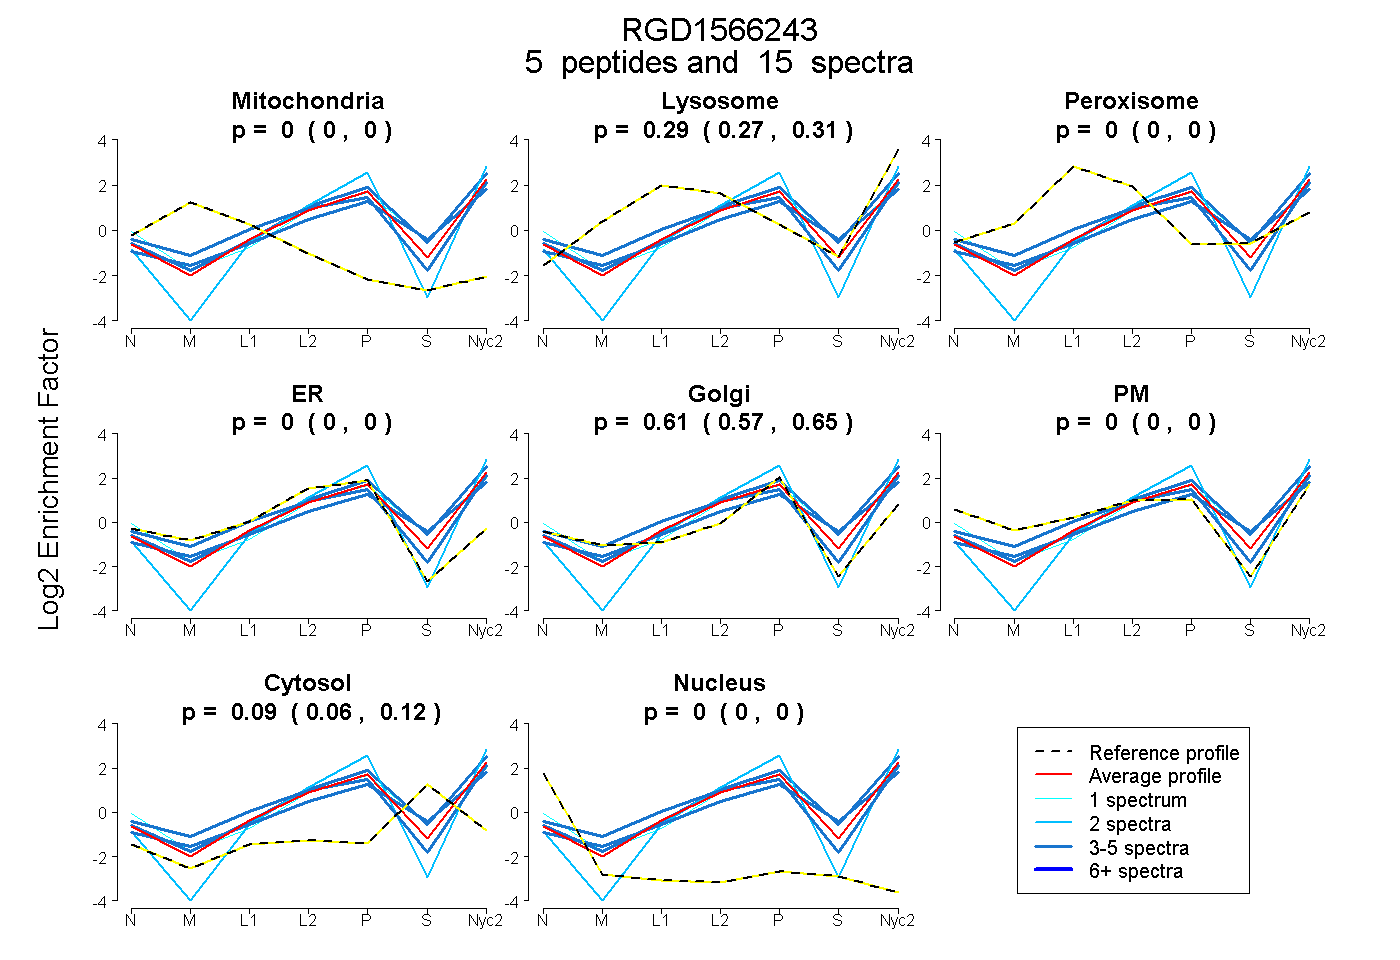
 5
5peptides
spectra
0.000 | 0.000
0.270 | 0.313
0.000 | 0.000
0.000 | 0.000
0.571 | 0.647
0.000 | 0.000
0.063 | 0.122
0.000 | 0.000
| Plot | Mito | Lyso | Perox | ER | Golgi | PM | Cytosol | Nucleus | |||||
| Expt A |
5 peptides |
15 spectra |
|
0.000 0.000 | 0.000 |
0.294 0.270 | 0.313 |
0.000 0.000 | 0.000 |
0.000 0.000 | 0.000 |
0.613 0.571 | 0.647 |
0.000 0.000 | 0.000 |
0.094 0.063 | 0.122 |
0.000 0.000 | 0.000 |
| 4 spectra, MSSPALK | 0.000 | 0.299 | 0.000 | 0.000 | 0.448 | 0.000 | 0.252 | 0.000 | ||
| 4 spectra, GYGGDFLR | 0.000 | 0.356 | 0.000 | 0.000 | 0.534 | 0.000 | 0.111 | 0.000 | ||
| 4 spectra, VPLNPSVSPTETELR | 0.000 | 0.286 | 0.000 | 0.000 | 0.474 | 0.226 | 0.014 | 0.000 | ||
| 1 spectrum, AGASGK | 0.000 | 0.178 | 0.000 | 0.000 | 0.429 | 0.208 | 0.185 | 0.000 | ||
| 2 spectra, LPASFNQWDLIMK | 0.000 | 0.120 | 0.000 | 0.000 | 0.880 | 0.000 | 0.000 | 0.000 |
| Plot | Mito | Lyso or Perox | ER | Golgi | PM | Cytosol | Nucleus | ||||||
| Expt B |
3 peptides |
5 spectra |
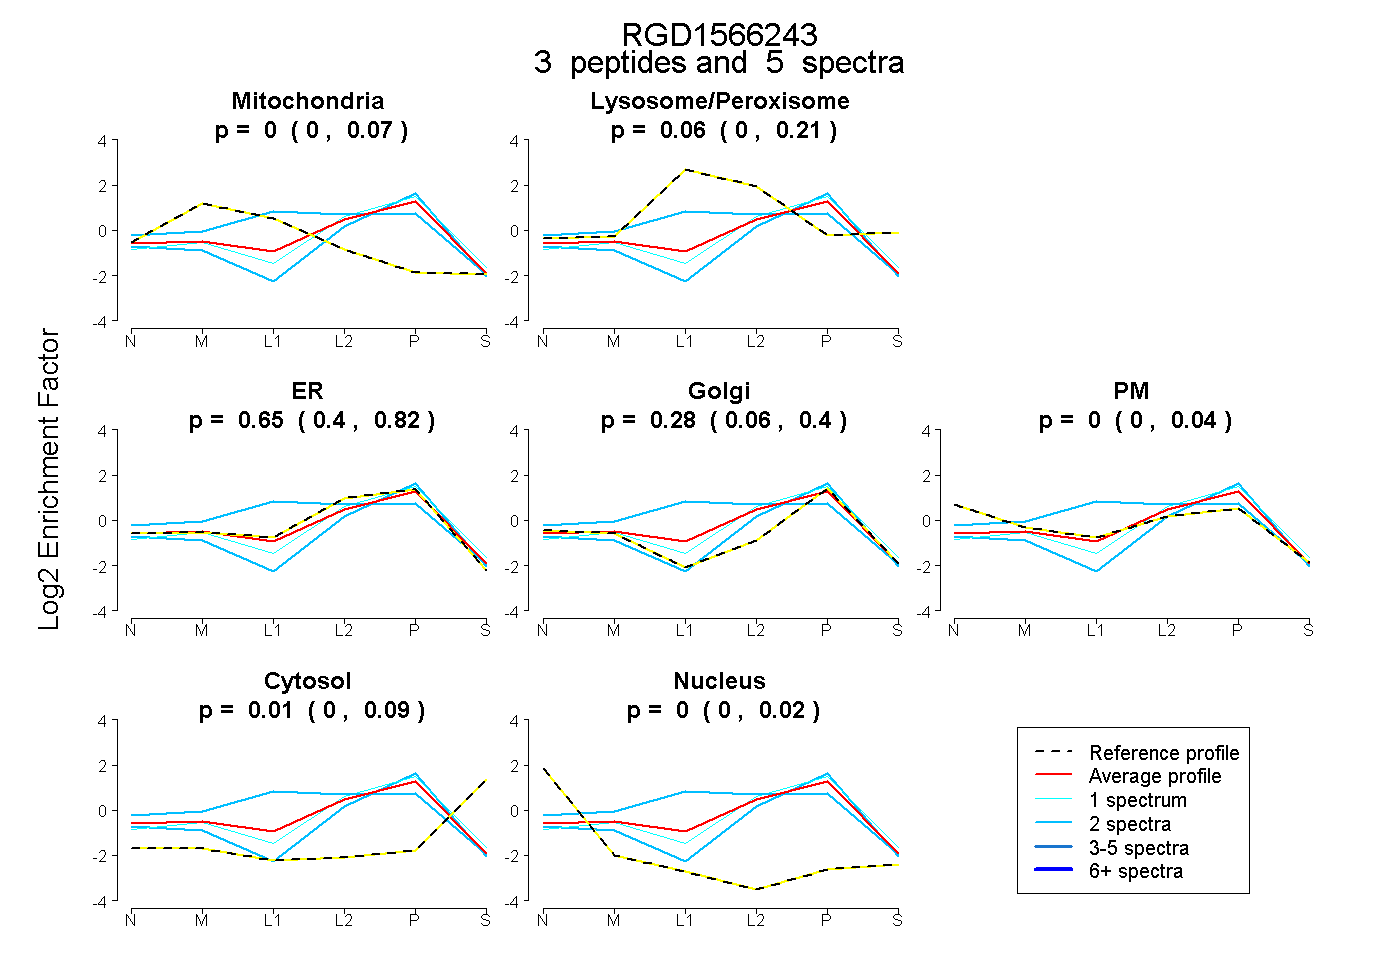 |
0.000 0.000 | 0.066 |
0.060 0.000 | 0.211 |
0.651 0.404 | 0.820 |
0.275 0.065 | 0.397 |
0.000 0.000 | 0.039 |
0.013 0.000 | 0.087 |
0.000 0.000 | 0.021 |
|||
| Plot | Lyso | Other | |||||||||||
| Expt C |
5 peptides |
66 spectra |
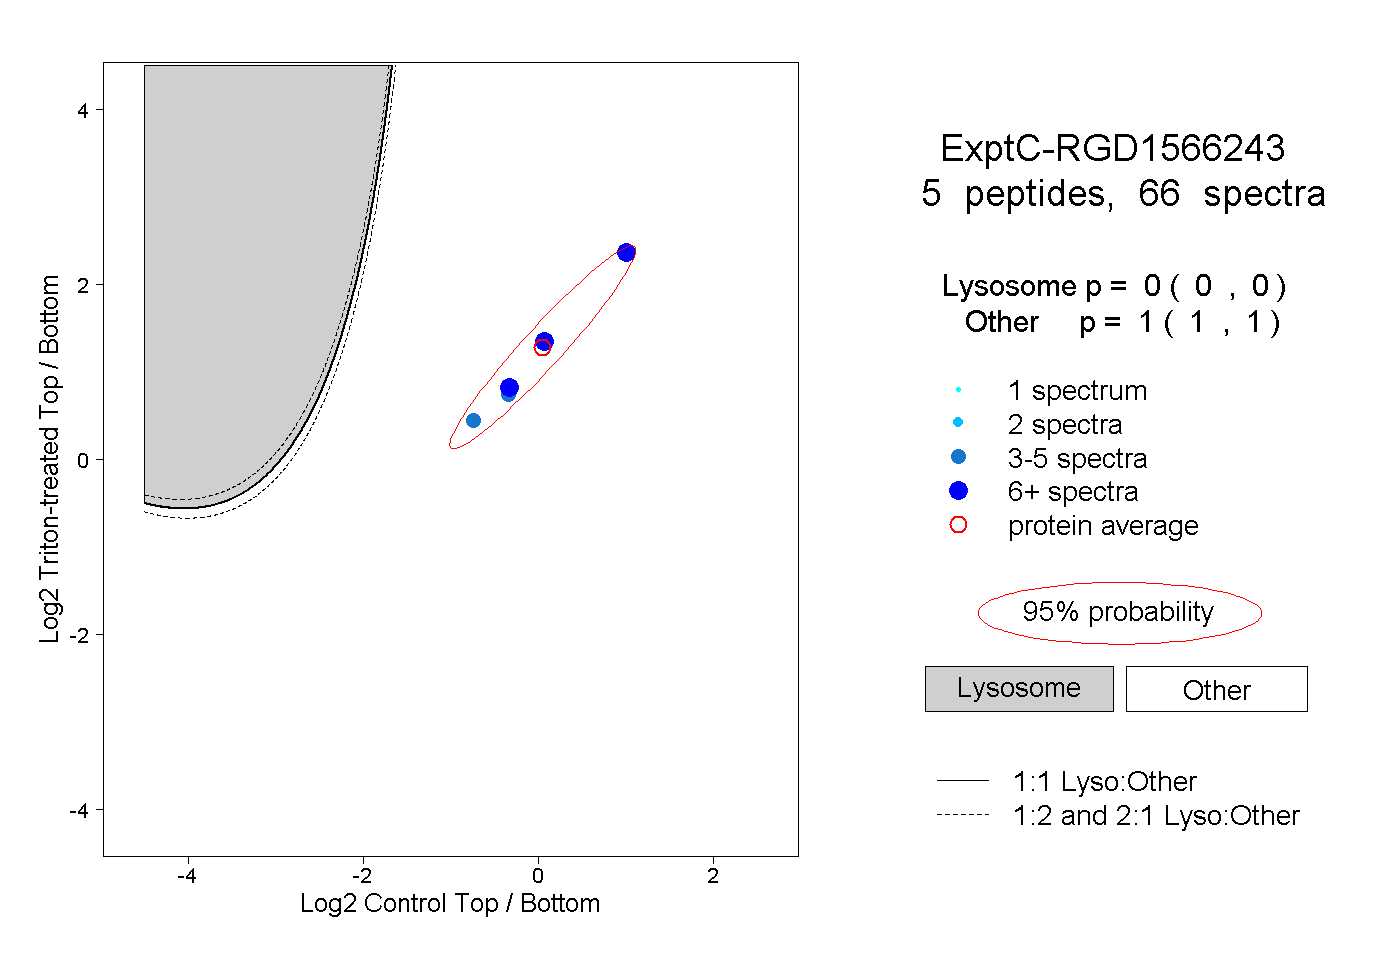 |
0.000 0.000 | 0.000 |
1.000 1.000 | 1.000 |
||||||||
| Plot | Lyso | Other | |||||||||||
| Expt D |
2 peptides |
3 spectra |
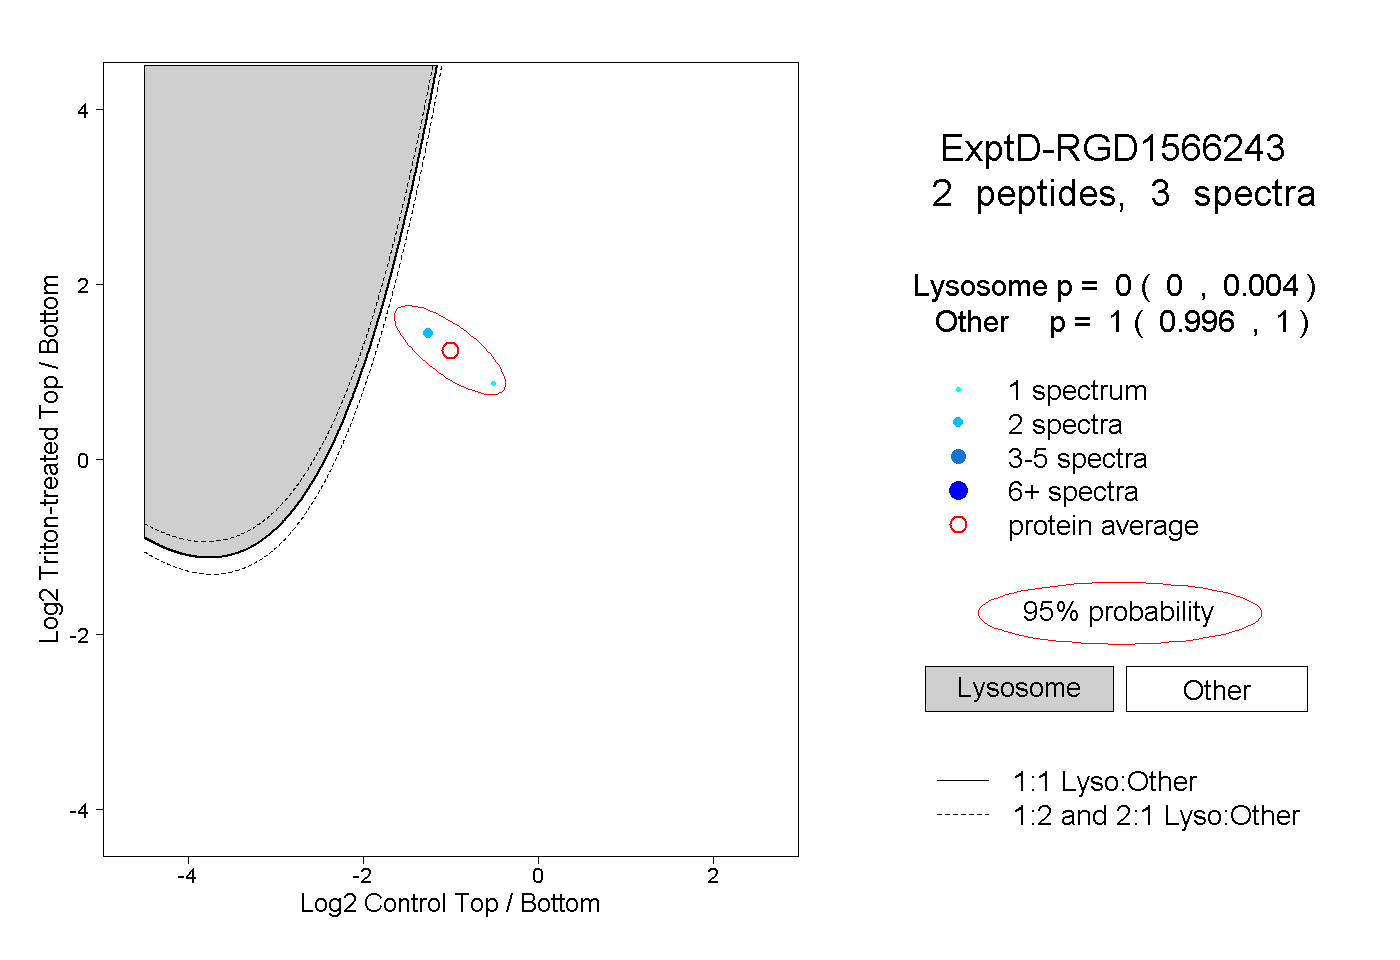 |
0.000 0.000 | 0.004 |
1.000 0.996 | 1.000 |