 6
6peptides
spectra
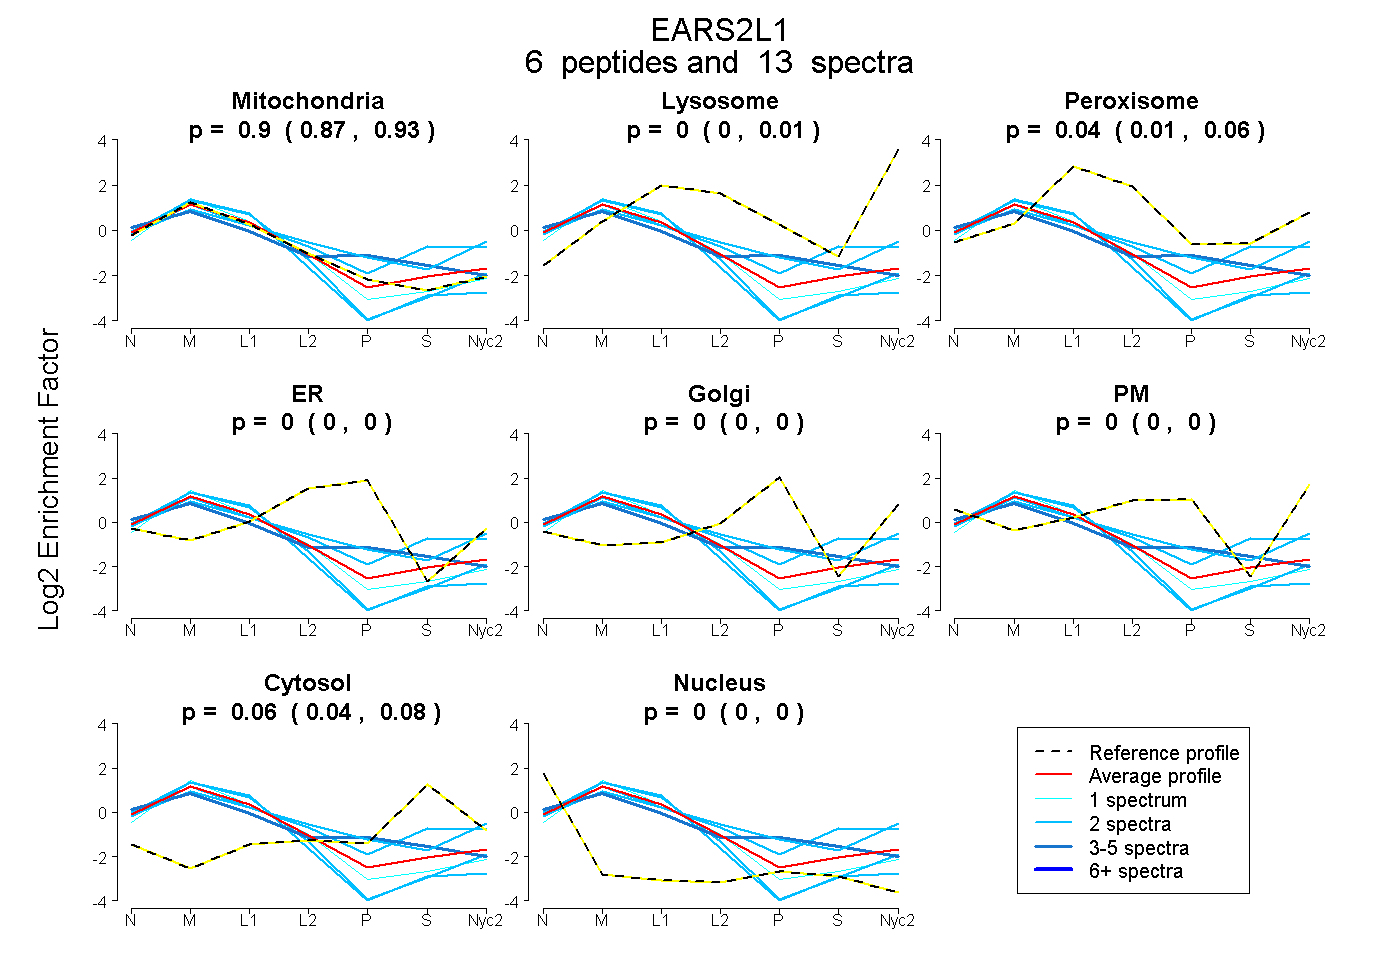
0.866 | 0.929
0.000 | 0.013
0.013 | 0.061
0.000 | 0.000
0.000 | 0.000
0.000 | 0.000
0.036 | 0.076
0.000 | 0.000
14peptides
spectra
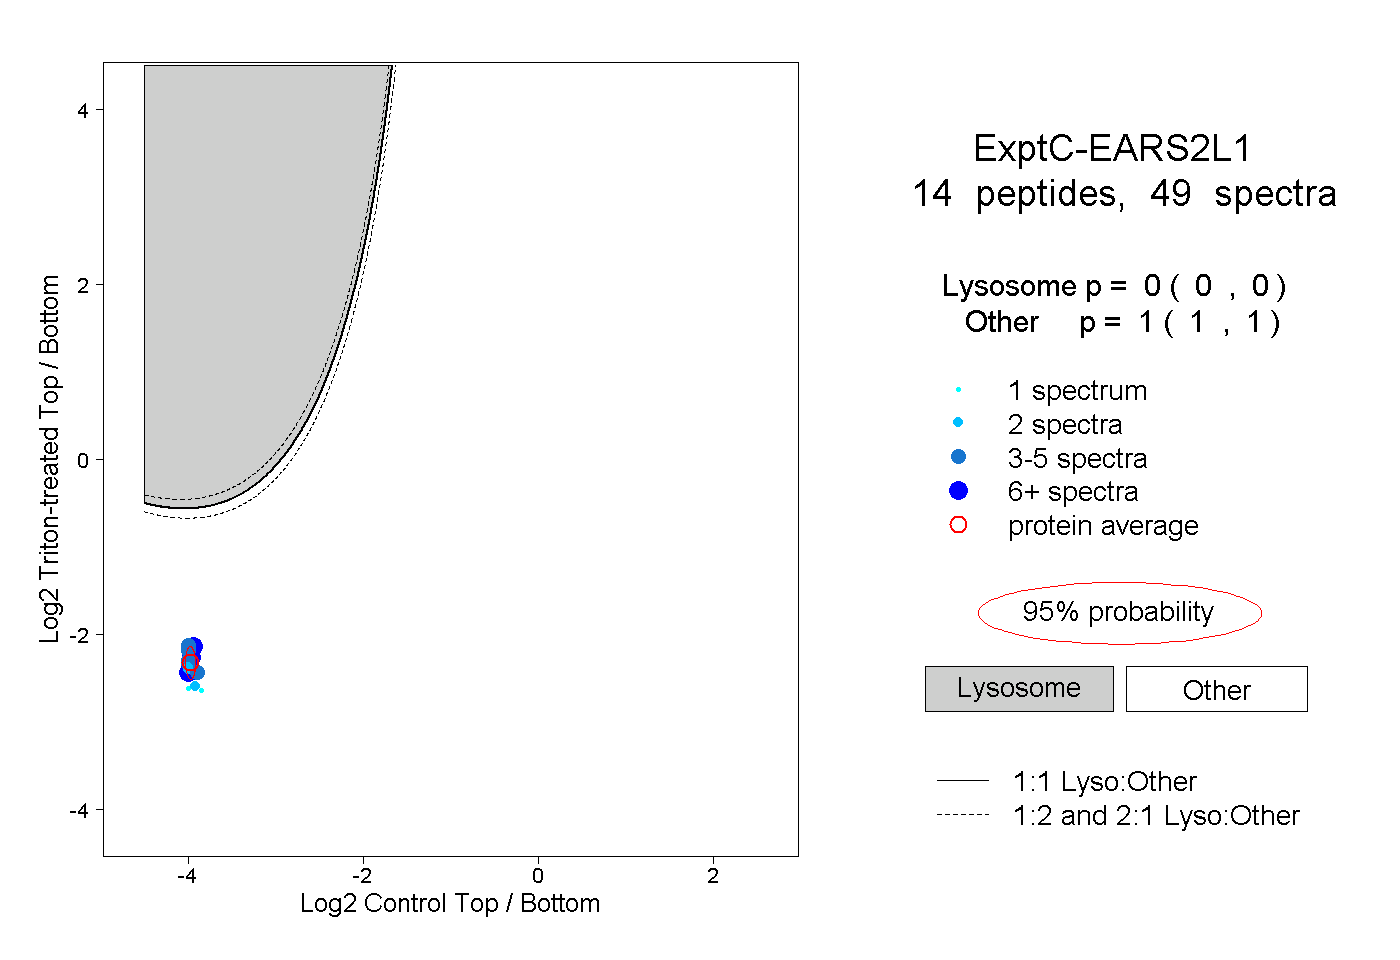
0.000 | 0.000
1.000 | 1.000
2peptides
spectra
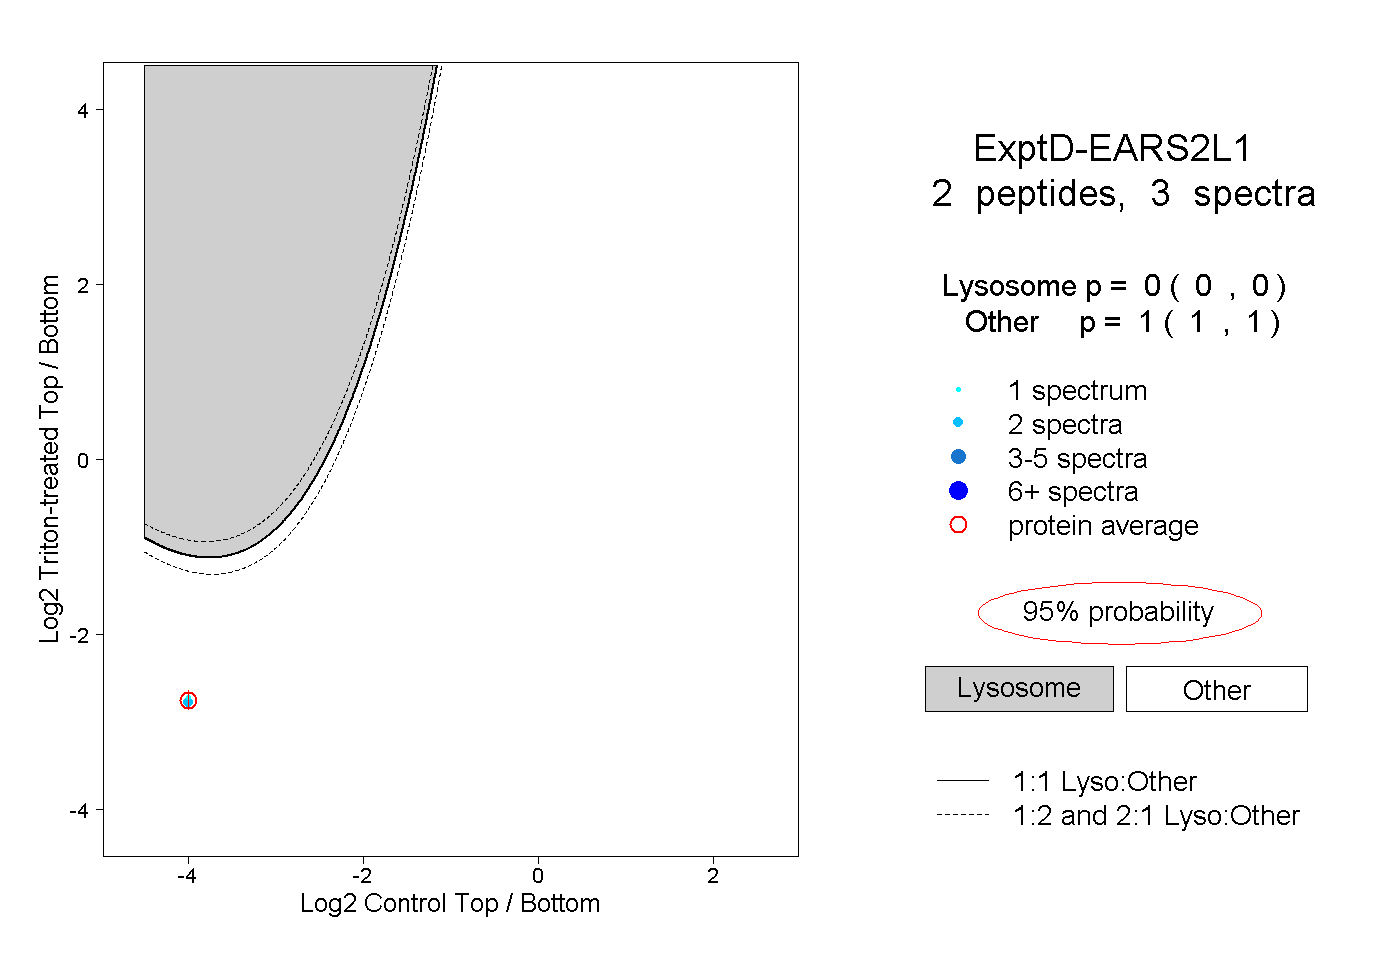
0.000 | 0.000
1.000 | 1.000