 6
6peptides
spectra
0.866 | 0.929
0.000 | 0.013
0.013 | 0.061
0.000 | 0.000
0.000 | 0.000
0.000 | 0.000
0.036 | 0.076
0.000 | 0.000
| Plot | Mito | Lyso | Perox | ER | Golgi | PM | Cytosol | Nucleus | |||||
| Expt A |
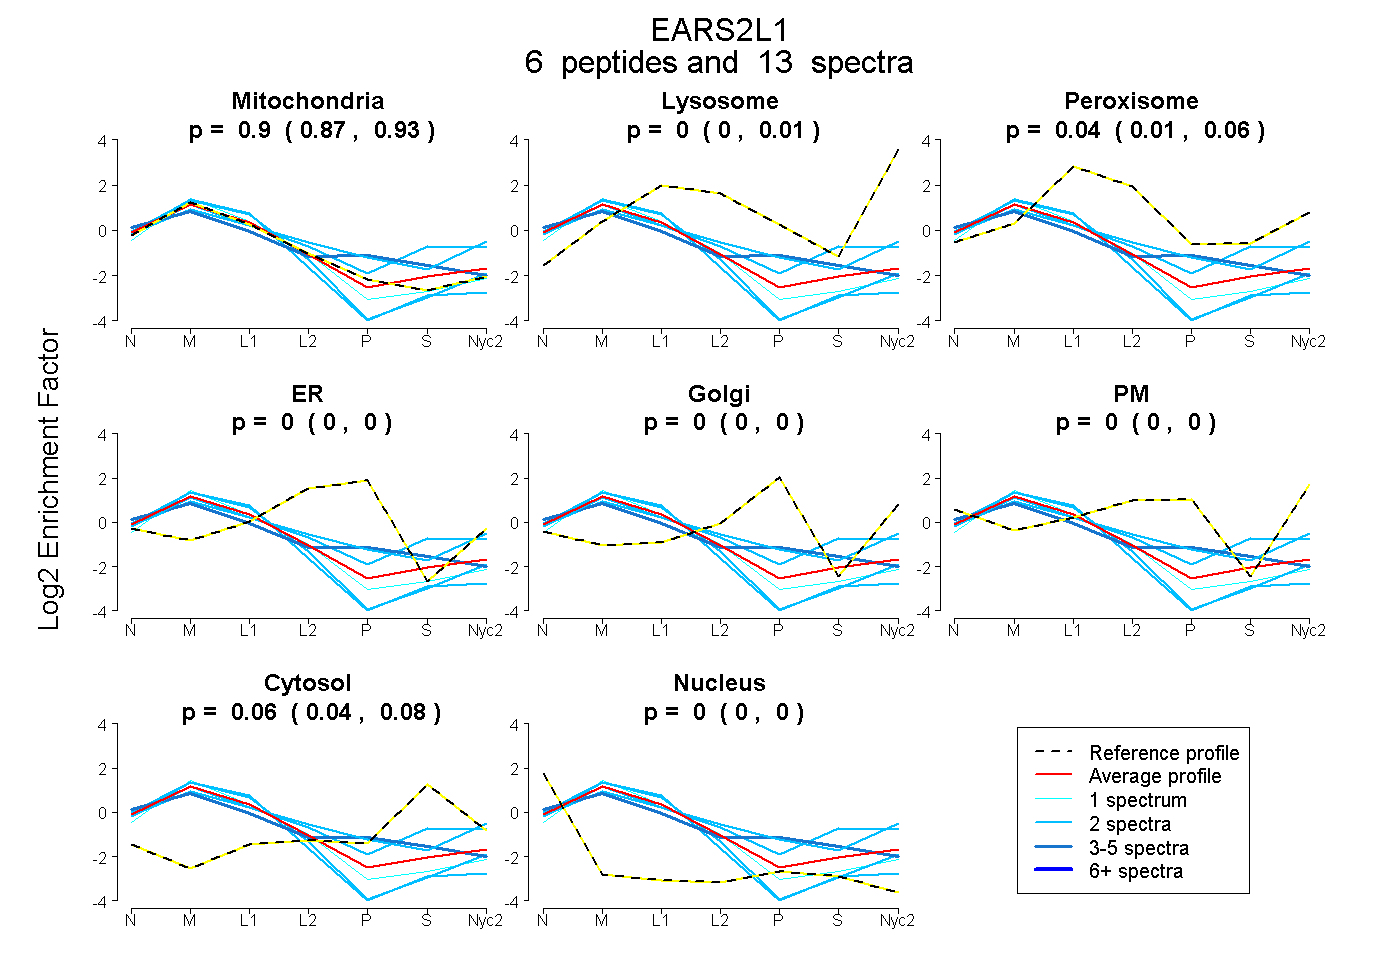
6 peptides |
13 spectra |
|
0.901 0.866 | 0.929 |
0.000 0.000 | 0.013 |
0.042 0.013 | 0.061 |
0.000 0.000 | 0.000 |
0.000 0.000 | 0.000 |
0.000 0.000 | 0.000 |
0.058 0.036 | 0.076 |
0.000 0.000 | 0.000 |
| 2 spectra, GGPAGPYYQSQR | 0.961 | 0.000 | 0.000 | 0.000 | 0.000 | 0.000 | 0.000 | 0.039 | ||
| 2 spectra, LVSSETQRPHLVEK | 0.650 | 0.164 | 0.000 | 0.000 | 0.000 | 0.121 | 0.066 | 0.000 | ||
| 2 spectra, LATDPKPAIR | 0.581 | 0.048 | 0.158 | 0.000 | 0.000 | 0.000 | 0.213 | 0.000 | ||
| 2 spectra, GSEWLVSTSK | 1.000 | 0.000 | 0.000 | 0.000 | 0.000 | 0.000 | 0.000 | 0.000 | ||
| 4 spectra, LEDTDQSR | 0.743 | 0.000 | 0.000 | 0.053 | 0.053 | 0.000 | 0.139 | 0.013 | ||
| 1 spectrum, DVLDPAYMER | 1.000 | 0.000 | 0.000 | 0.000 | 0.000 | 0.000 | 0.000 | 0.000 |
| Plot | Lyso | Other | |||||||||||
| Expt C |
14 peptides |
49 spectra |
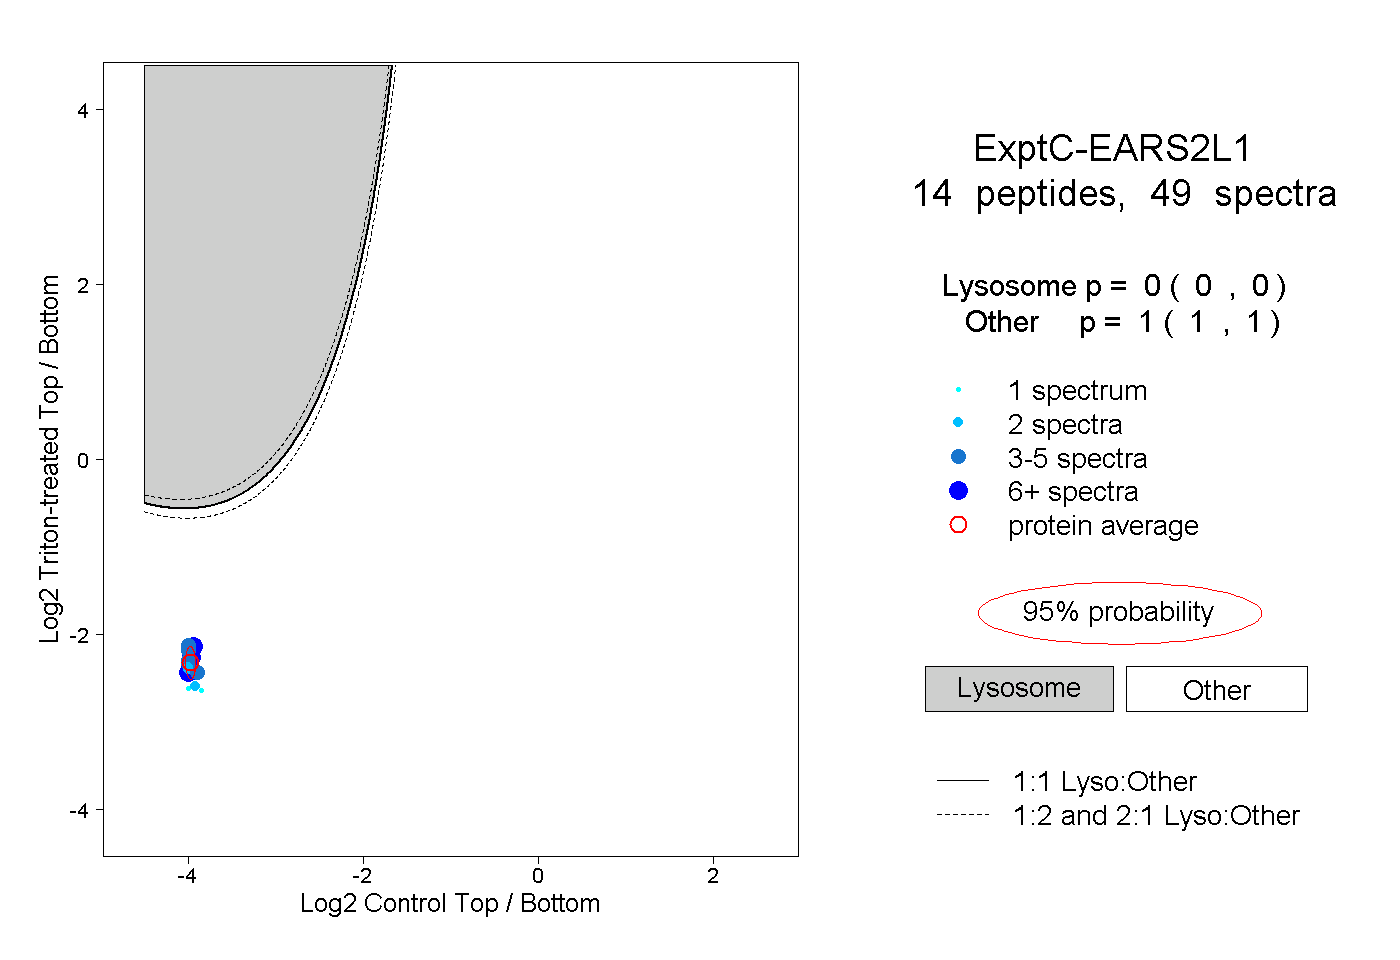 |
0.000 0.000 | 0.000 |
1.000 1.000 | 1.000 |
||||||||
| Plot | Lyso | Other | |||||||||||
| Expt D |
2 peptides |
3 spectra |
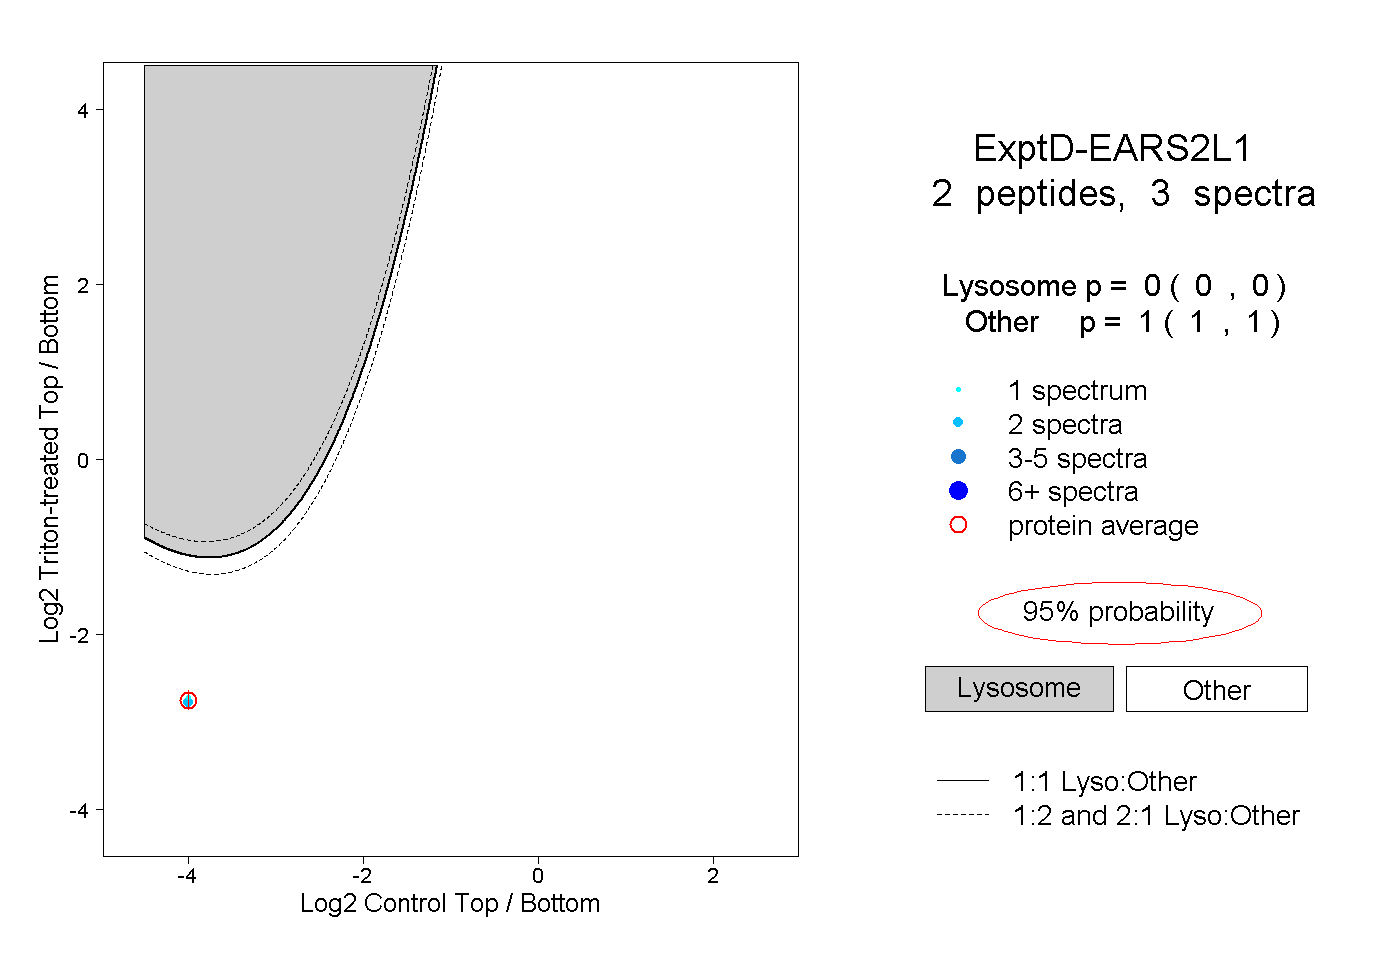 |
0.000 0.000 | 0.000 |
1.000 1.000 | 1.000 |