 11
11peptides
spectra
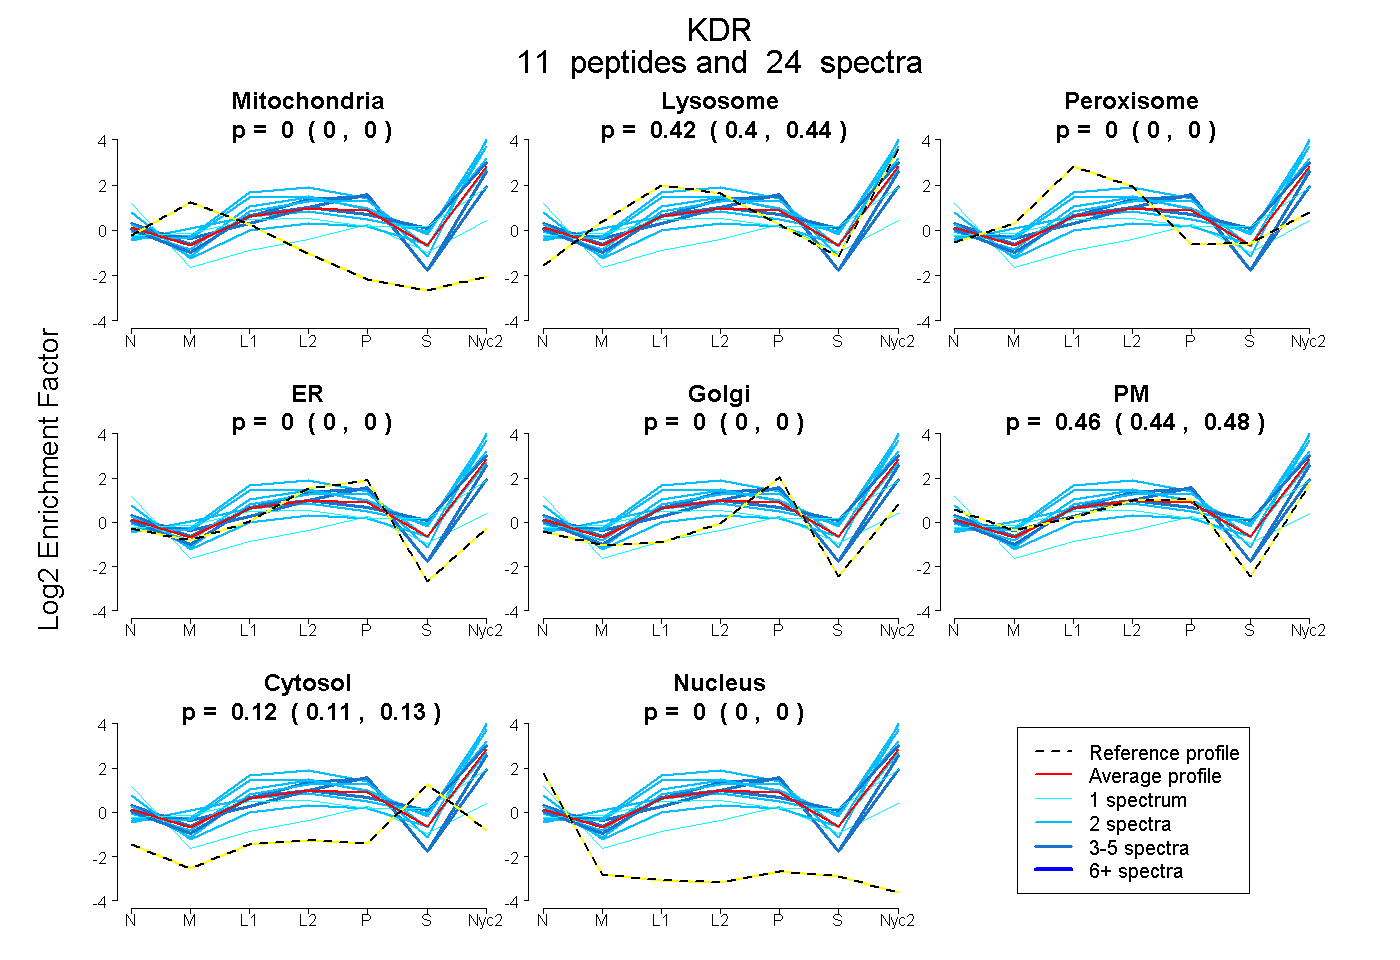
0.000 | 0.000
0.398 | 0.441
0.000 | 0.000
0.000 | 0.000
0.000 | 0.000
0.438 | 0.480
0.105 | 0.130
0.000 | 0.000
10peptides
spectra
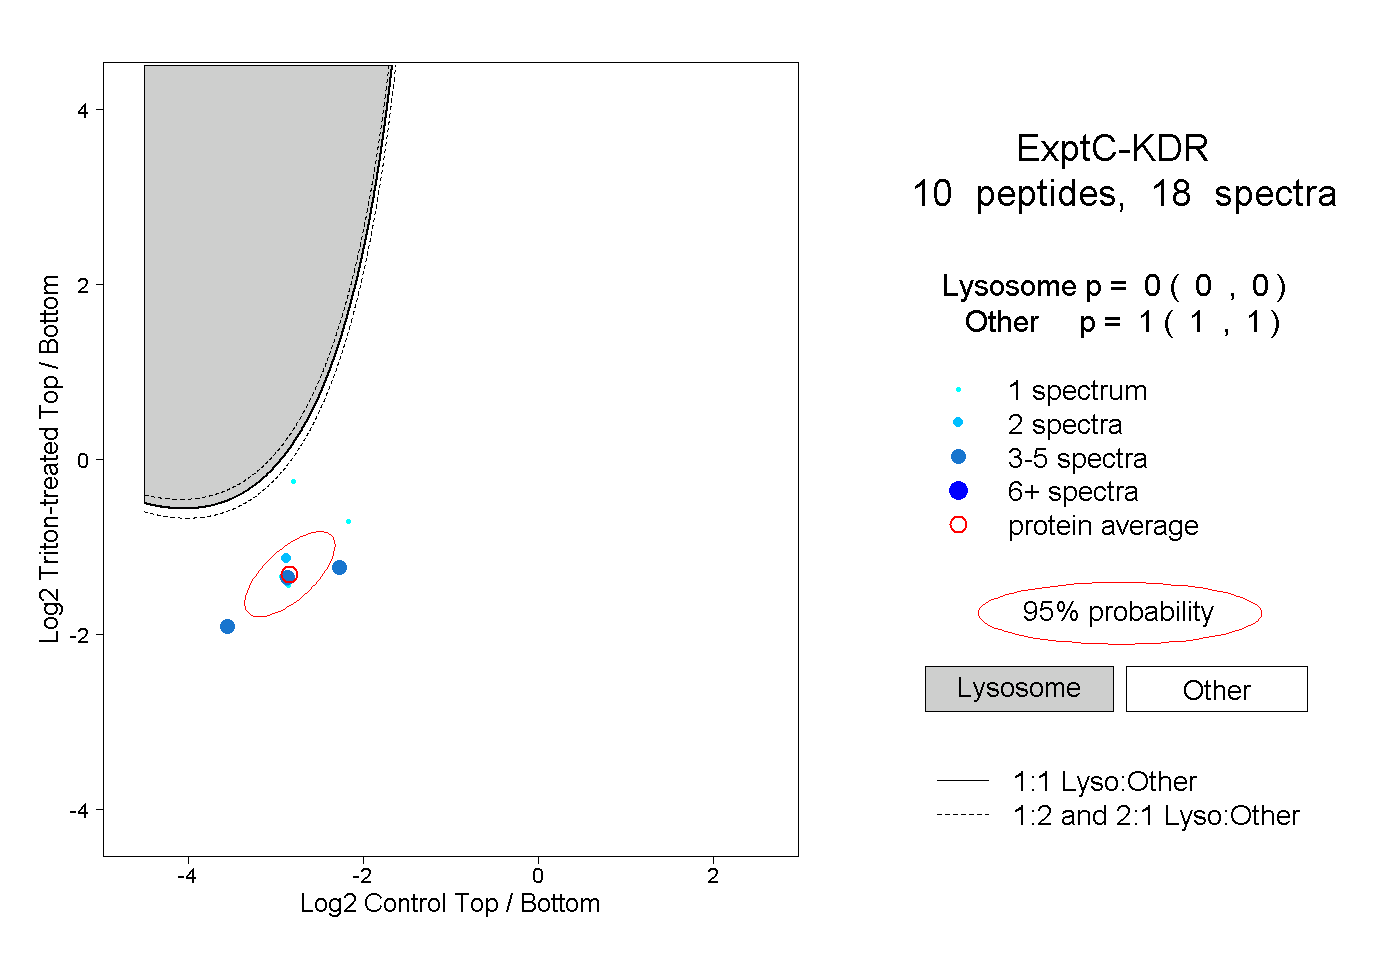
0.000 | 0.000
1.000 | 1.000
1peptide
spectrum
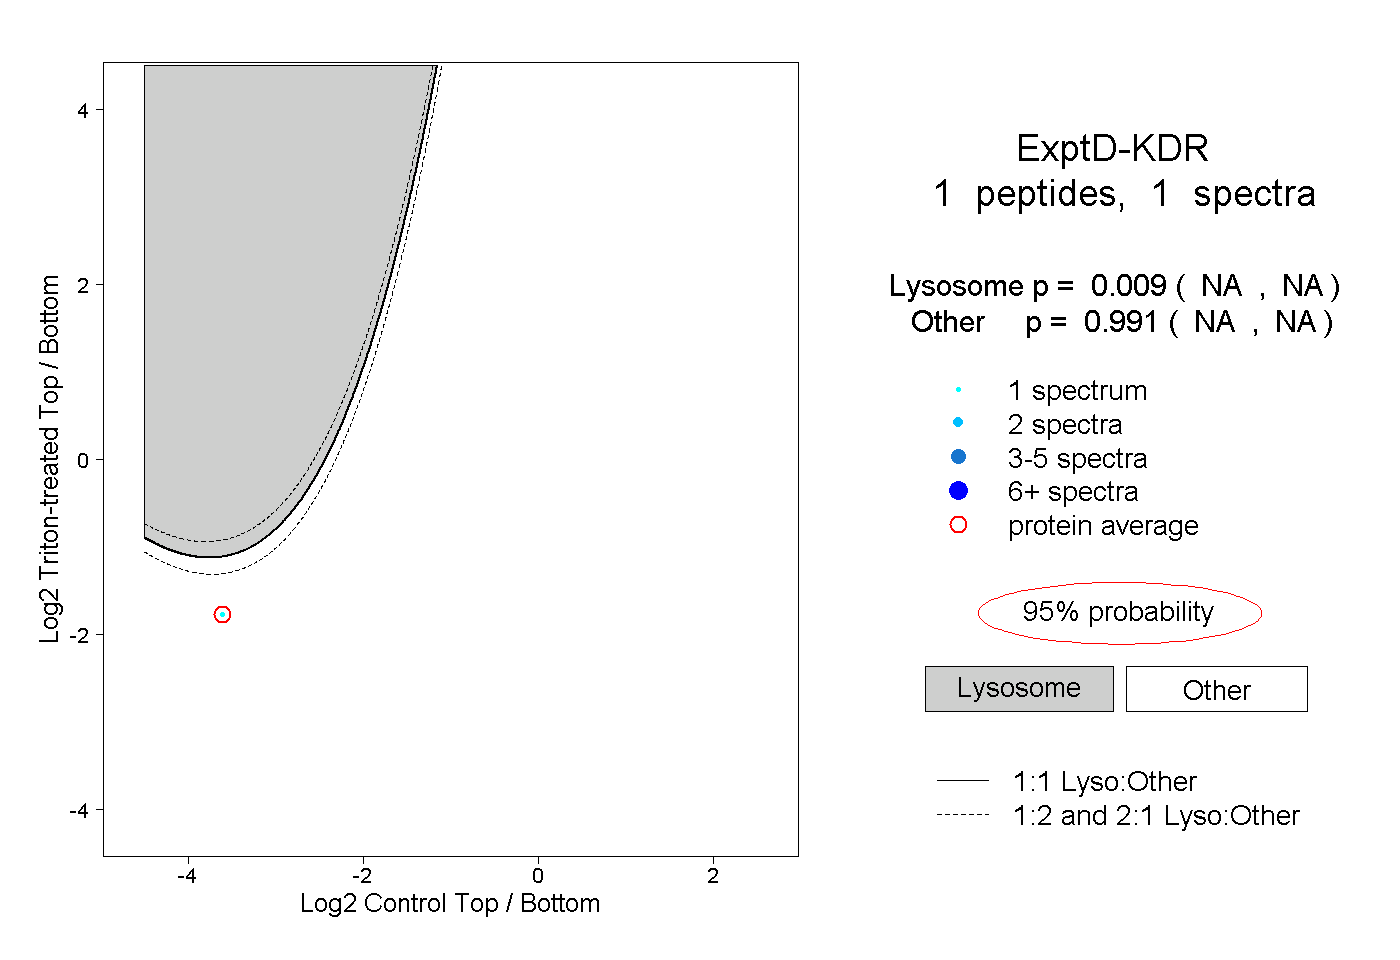
NA | NA
NA | NA