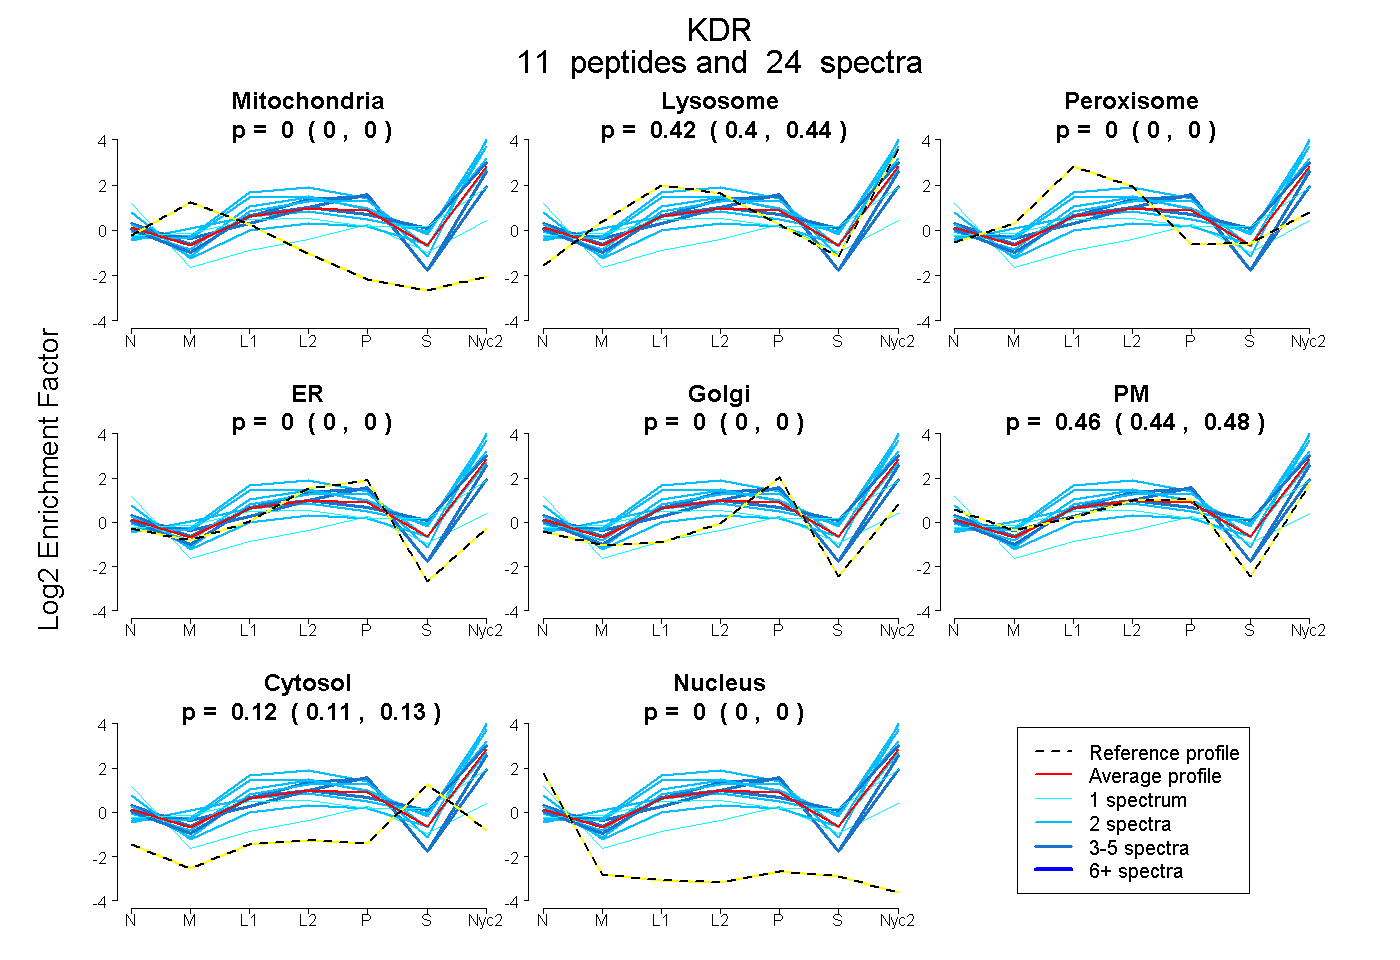
 11
11peptides
spectra
0.000 | 0.000
0.398 | 0.441
0.000 | 0.000
0.000 | 0.000
0.000 | 0.000
0.438 | 0.480
0.105 | 0.130
0.000 | 0.000
| Plot | Mito | Lyso | Perox | ER | Golgi | PM | Cytosol | Nucleus | |||||
| Expt A |
11 peptides |
24 spectra |
|
0.000 0.000 | 0.000 |
0.421 0.398 | 0.441 |
0.000 0.000 | 0.000 |
0.000 0.000 | 0.000 |
0.000 0.000 | 0.000 |
0.461 0.438 | 0.480 |
0.118 0.105 | 0.130 |
0.000 0.000 | 0.000 |
| 3 spectra, TVVIPCR | 0.000 | 0.520 | 0.000 | 0.000 | 0.000 | 0.282 | 0.198 | 0.000 | ||
| 2 spectra, TLTVPR | 0.000 | 0.784 | 0.000 | 0.000 | 0.000 | 0.168 | 0.049 | 0.000 | ||
| 2 spectra, QLVILER | 0.000 | 0.688 | 0.000 | 0.000 | 0.000 | 0.247 | 0.065 | 0.000 | ||
| 2 spectra, LGKPLGR | 0.000 | 0.496 | 0.000 | 0.000 | 0.000 | 0.473 | 0.031 | 0.000 | ||
| 1 spectrum, VISFHVIR | 0.000 | 0.406 | 0.072 | 0.000 | 0.000 | 0.231 | 0.291 | 0.000 | ||
| 2 spectra, FVPDGNR | 0.000 | 0.659 | 0.000 | 0.000 | 0.000 | 0.174 | 0.168 | 0.000 | ||
| 2 spectra, AETLFIIEGAQEK | 0.000 | 0.742 | 0.000 | 0.000 | 0.000 | 0.258 | 0.000 | 0.000 | ||
| 1 spectrum, ALMSELK | 0.000 | 0.000 | 0.000 | 0.000 | 0.000 | 0.583 | 0.261 | 0.155 | ||
| 3 spectra, GMEFLASR | 0.000 | 0.208 | 0.000 | 0.008 | 0.258 | 0.525 | 0.000 | 0.000 | ||
| 4 spectra, IDEEFCR | 0.000 | 0.250 | 0.000 | 0.000 | 0.030 | 0.720 | 0.000 | 0.000 | ||
| 2 spectra, ISWDSEK | 0.000 | 0.213 | 0.000 | 0.000 | 0.000 | 0.563 | 0.225 | 0.000 |
| Plot | Lyso | Other | |||||||||||
| Expt C |
10 peptides |
18 spectra |
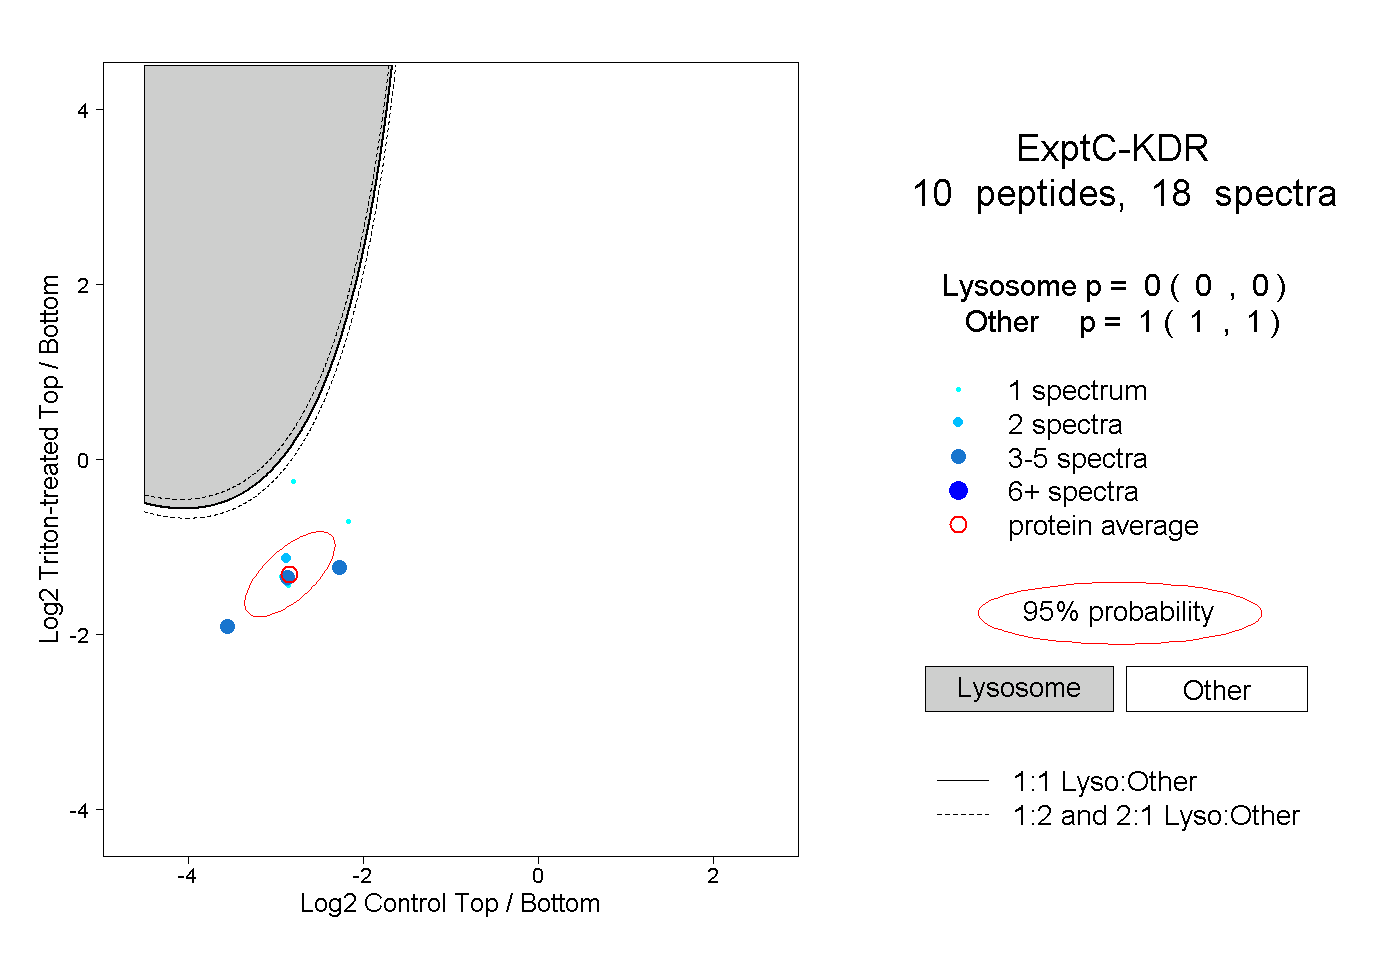 |
0.000 0.000 | 0.000 |
1.000 1.000 | 1.000 |
||||||||
| Plot | Lyso | Other | |||||||||||
| Expt D |
1 peptide |
1 spectrum |
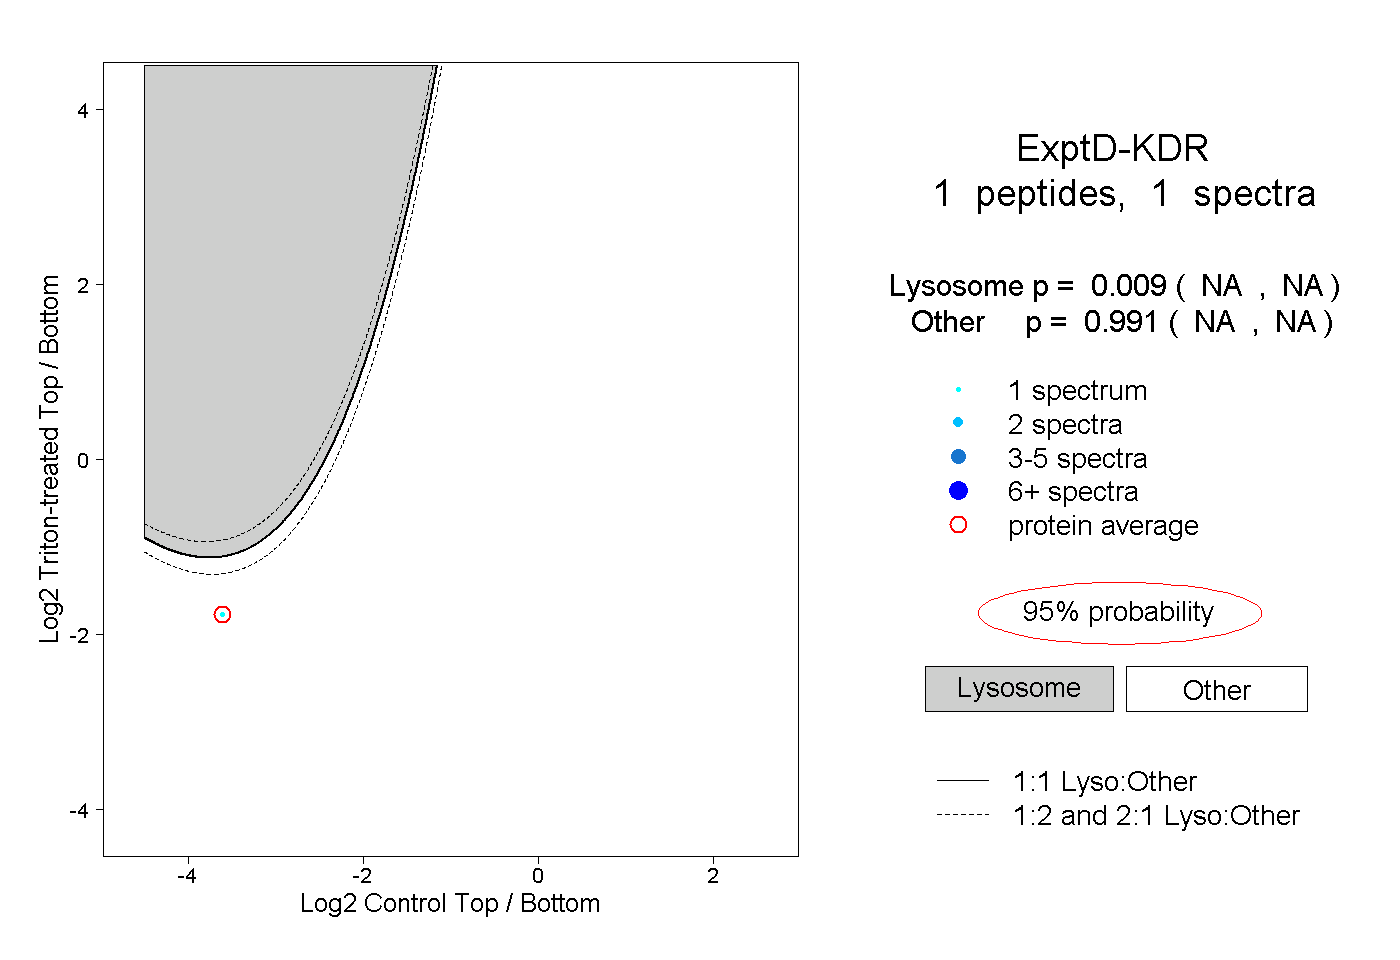 |
0.009 NA | NA |
0.991 NA | NA |