 76
76peptides
spectra
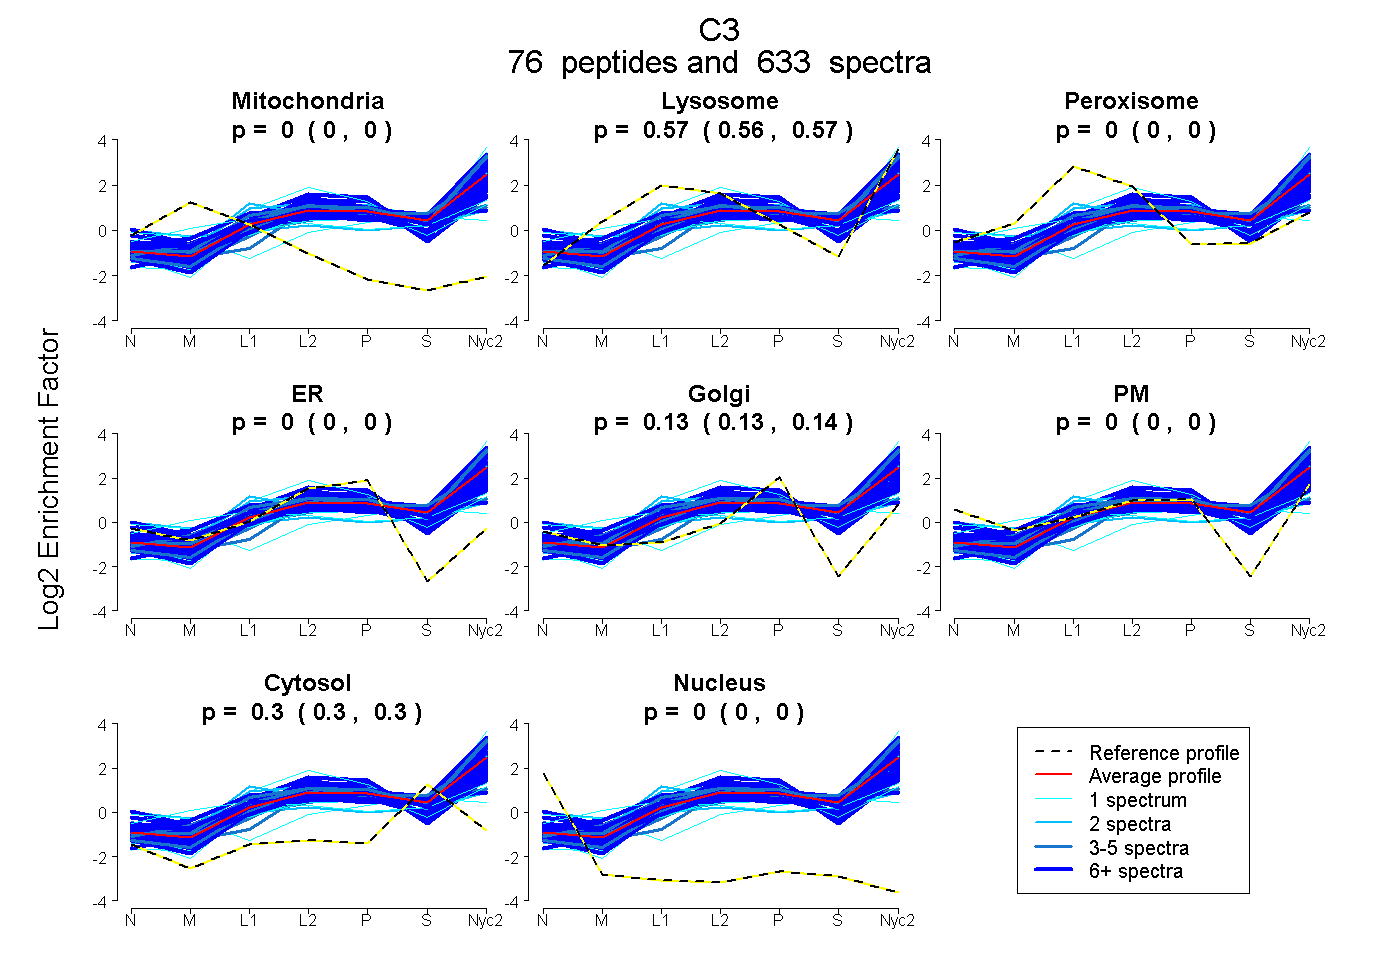
0.000 | 0.000
0.565 | 0.566
0.000 | 0.000
0.000 | 0.000
0.134 | 0.135
0.000 | 0.000
0.300 | 0.301
0.000 | 0.000
61peptides
spectra
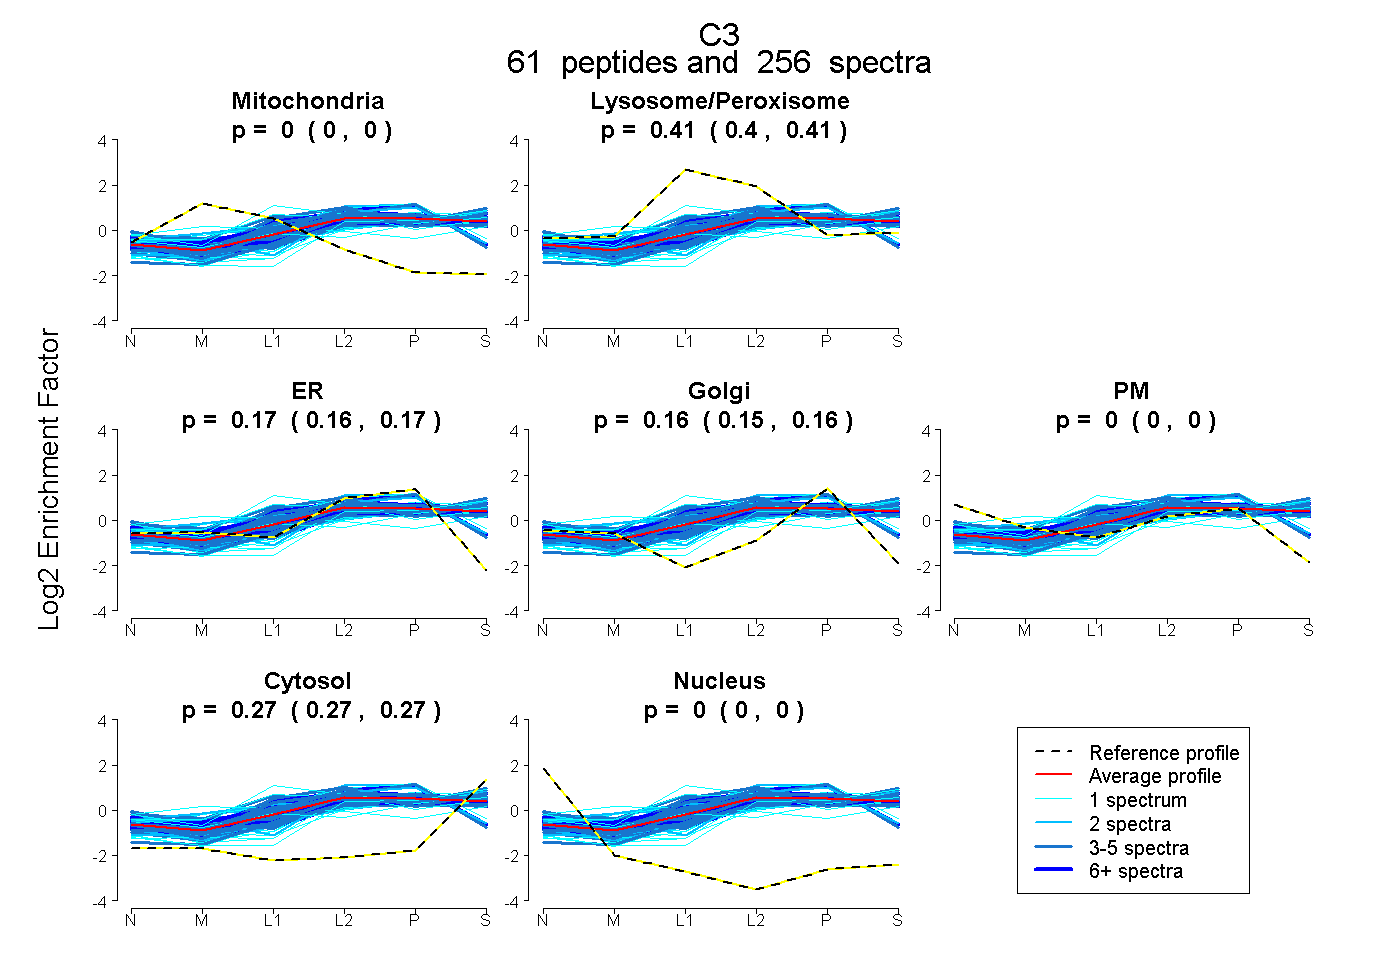
0.000 | 0.000
0.403 | 0.407
0.160 | 0.169
0.153 | 0.161
0.000 | 0.000
0.271 | 0.274
0.000 | 0.000
84peptides
spectra
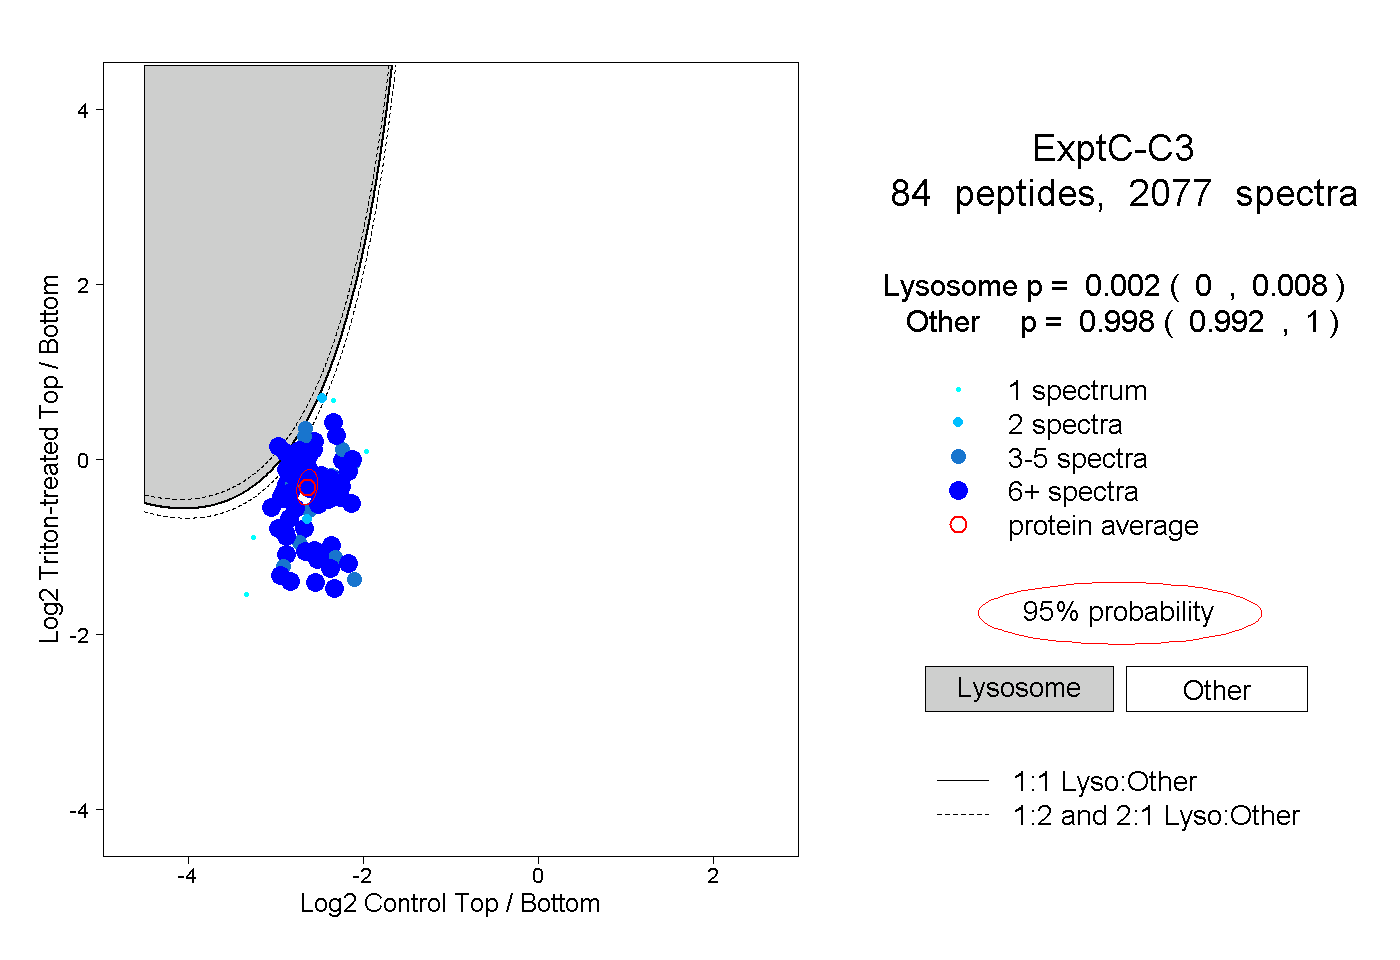
0.000 | 0.008
0.992 | 1.000
56peptides
spectra
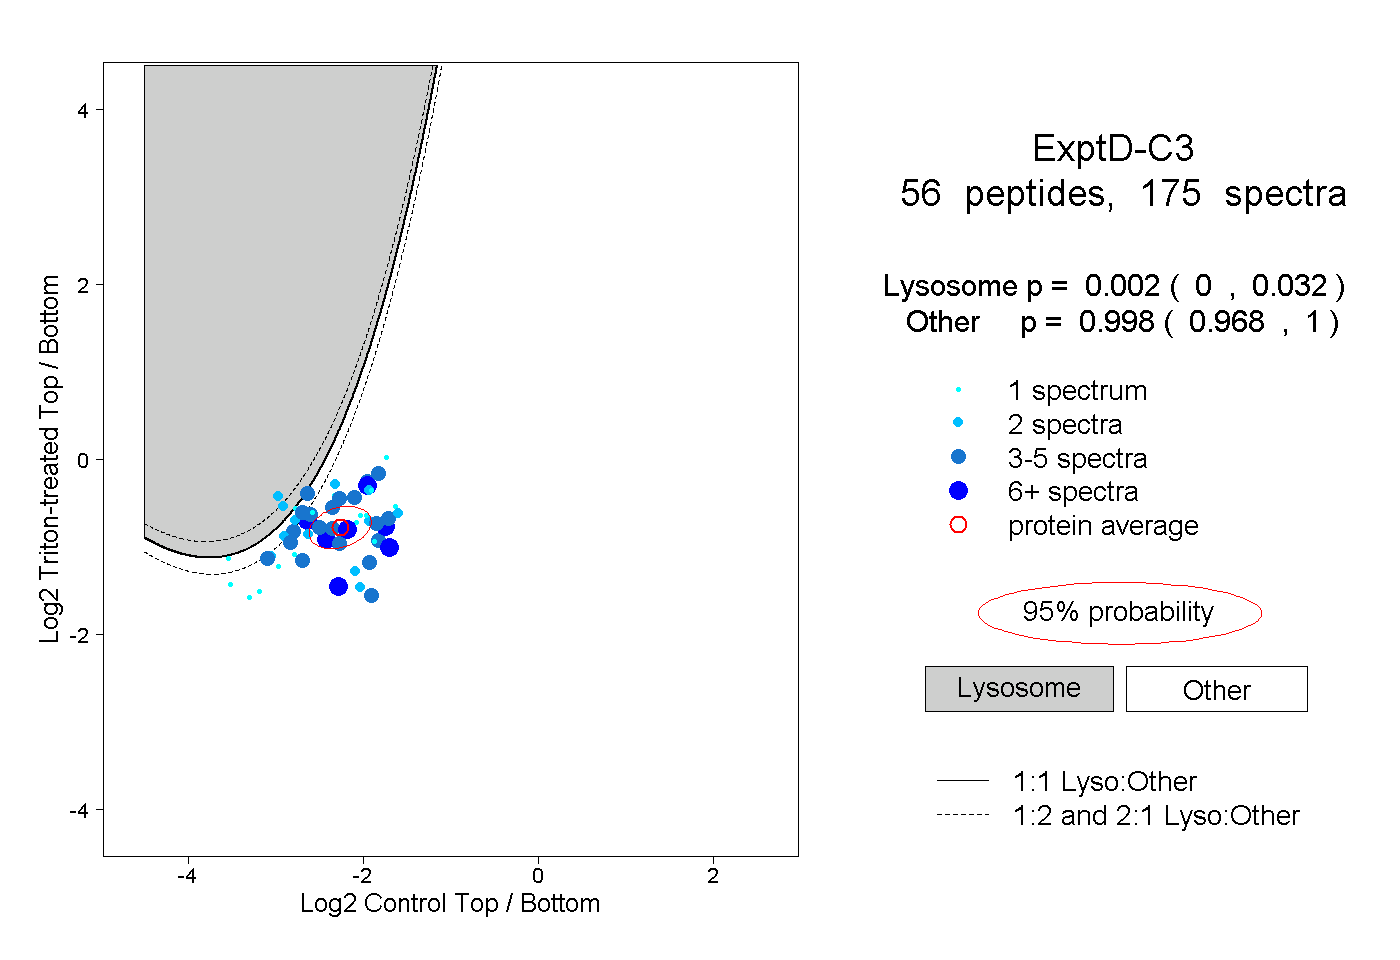
0.000 | 0.032
0.968 | 1.000