 5
5peptides
spectra
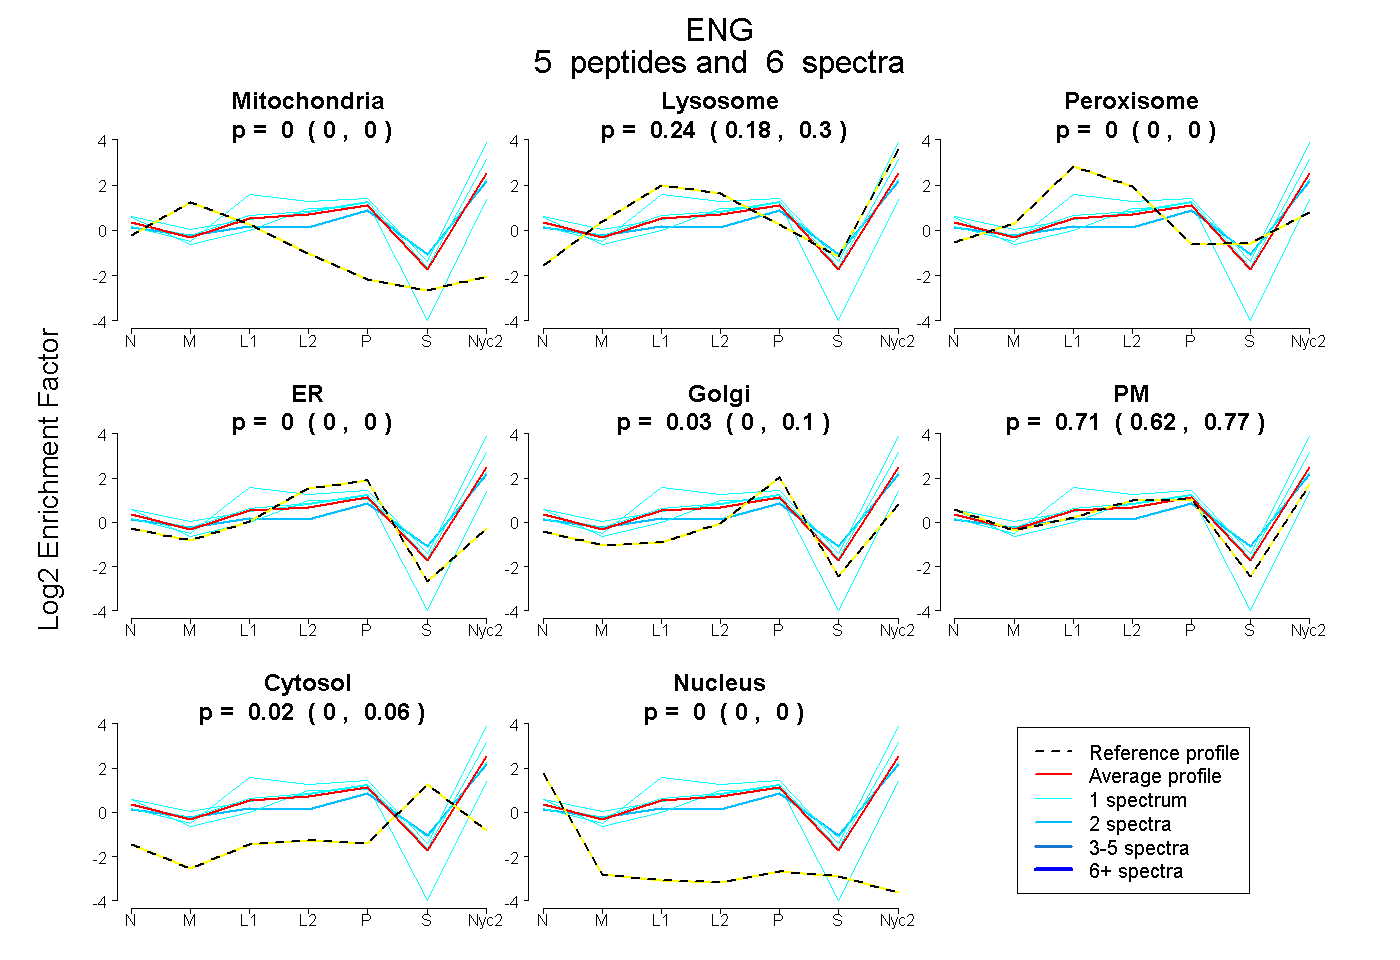
0.000 | 0.000
0.175 | 0.297
0.000 | 0.000
0.000 | 0.000
0.000 | 0.097
0.620 | 0.771
0.000 | 0.058
0.000 | 0.000
9peptides
spectra
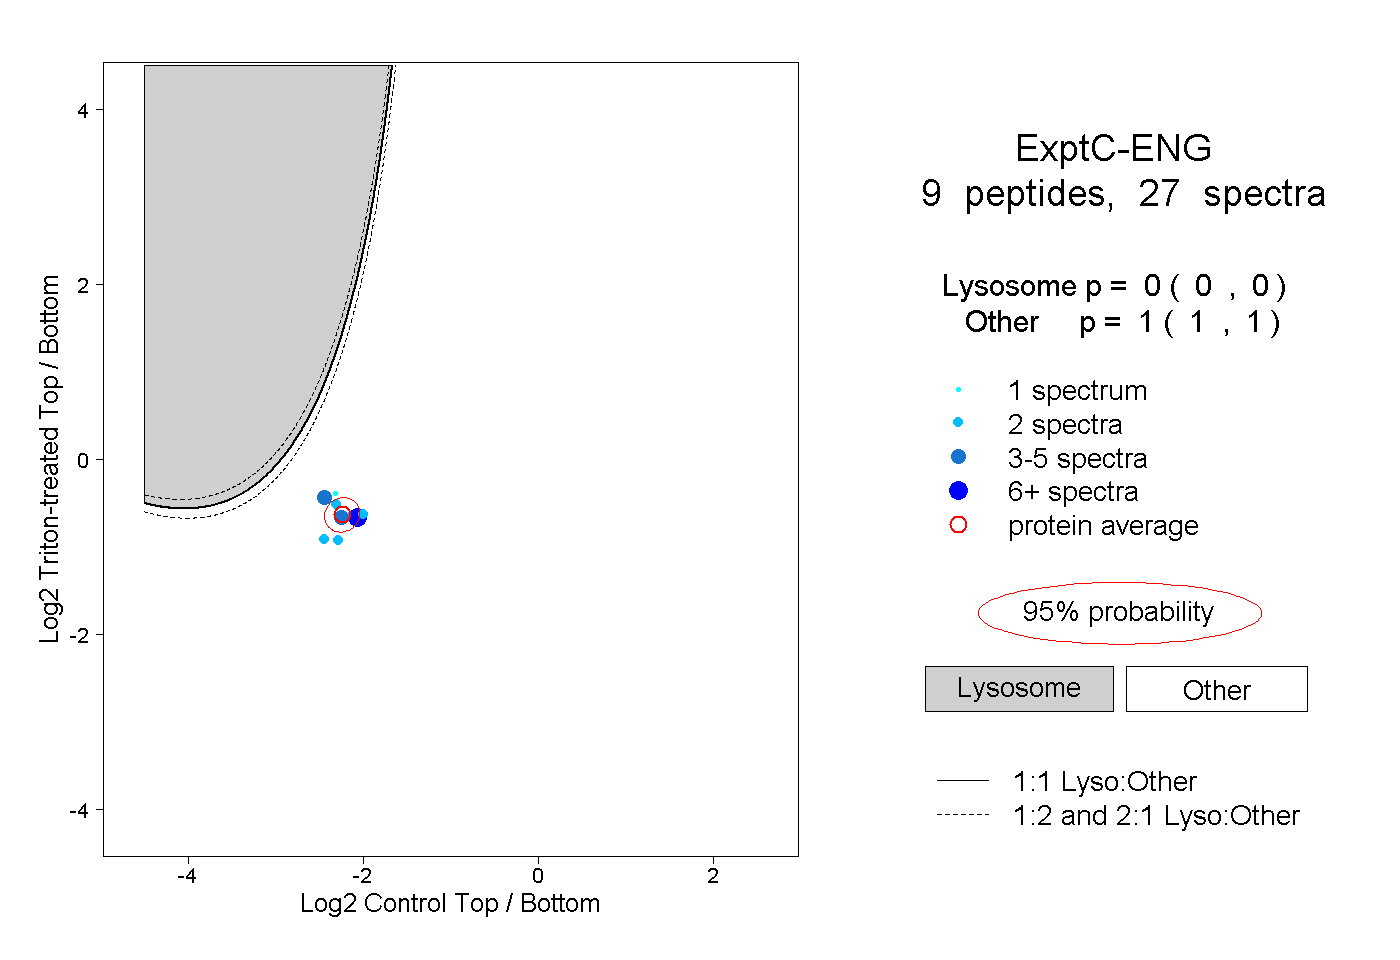
0.000 | 0.000
1.000 | 1.000
2peptides
spectra
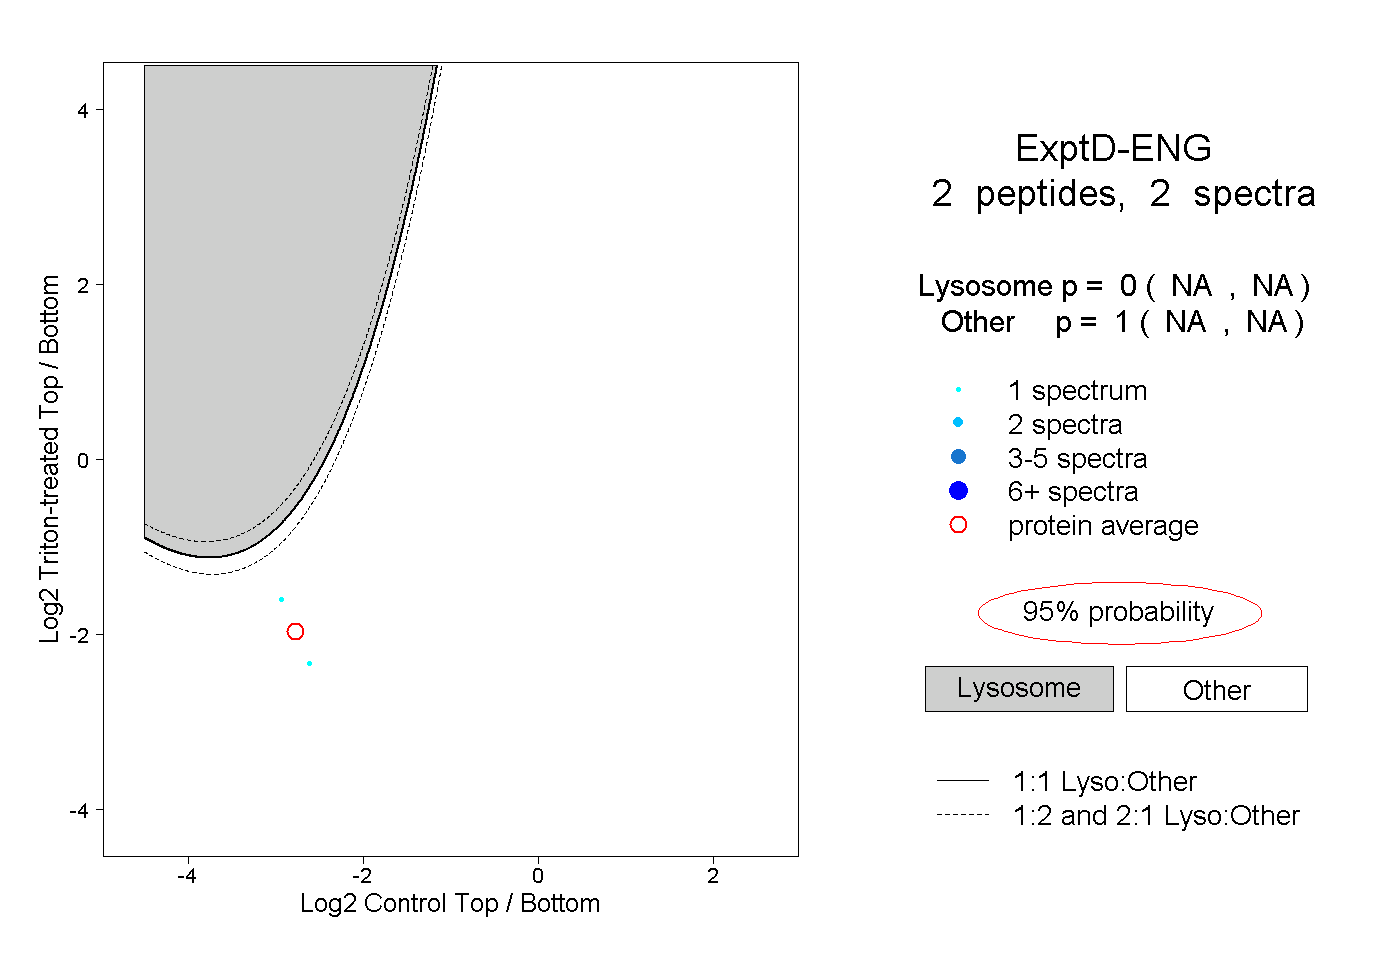
NA | NA
NA | NA