 5
5peptides
spectra
0.000 | 0.000
0.175 | 0.297
0.000 | 0.000
0.000 | 0.000
0.000 | 0.097
0.620 | 0.771
0.000 | 0.058
0.000 | 0.000
9peptides
spectra
0.000 | 0.000
1.000 | 1.000
| Plot | Mito | Lyso | Perox | ER | Golgi | PM | Cytosol | Nucleus | |||||
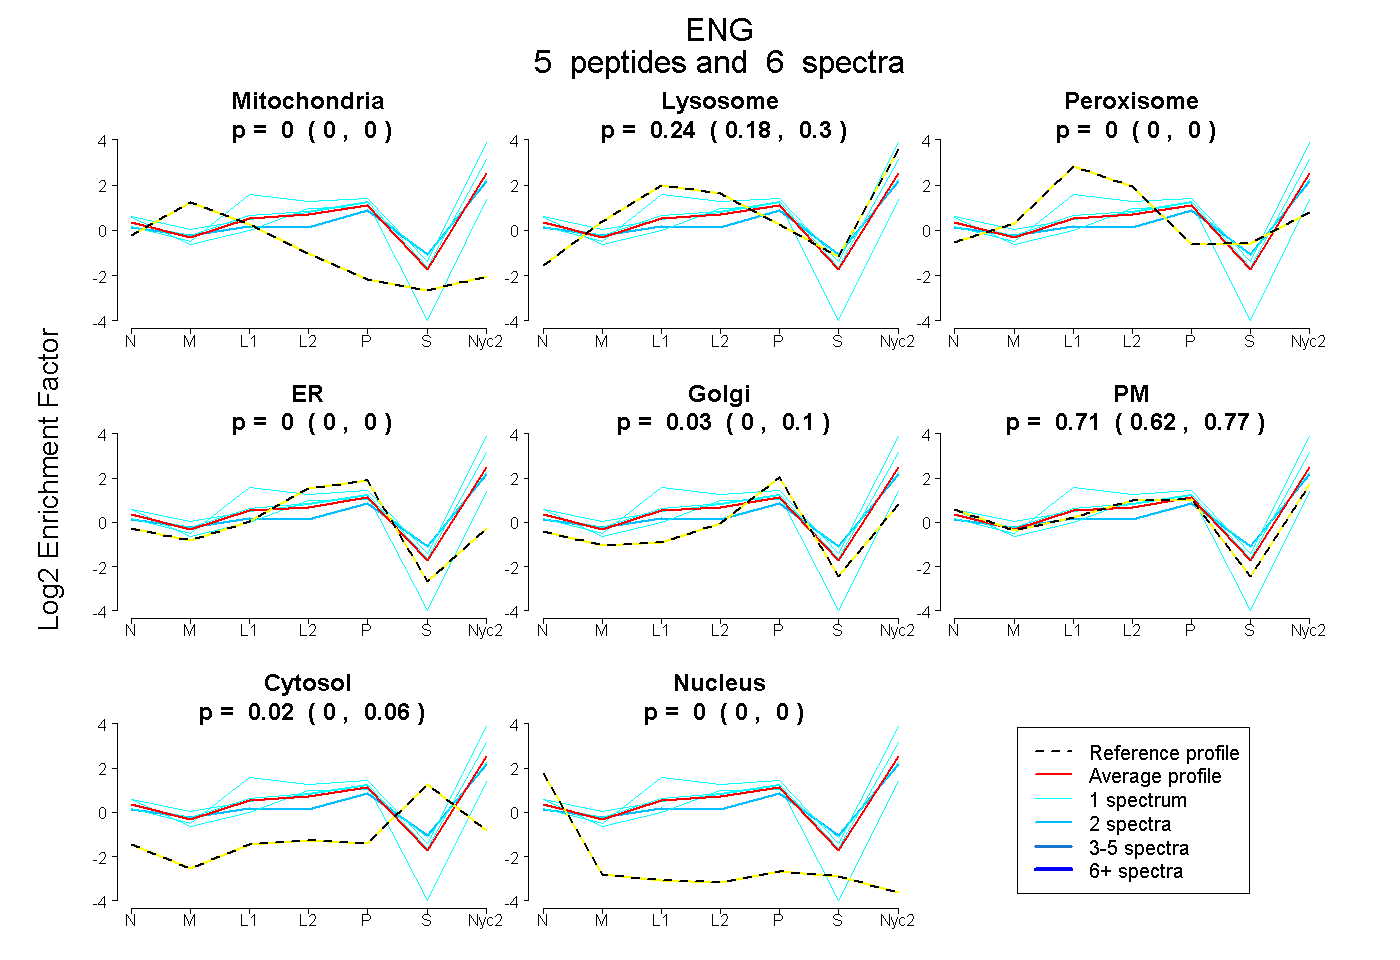
| Expt A |
5 peptides |
6 spectra |
|
0.000 0.000 | 0.000 |
0.242 0.175 | 0.297 |
0.000 0.000 | 0.000 |
0.000 0.000 | 0.000 |
0.035 0.000 | 0.097 |
0.708 0.620 | 0.771 |
0.016 0.000 | 0.058 |
0.000 0.000 | 0.000 |
||
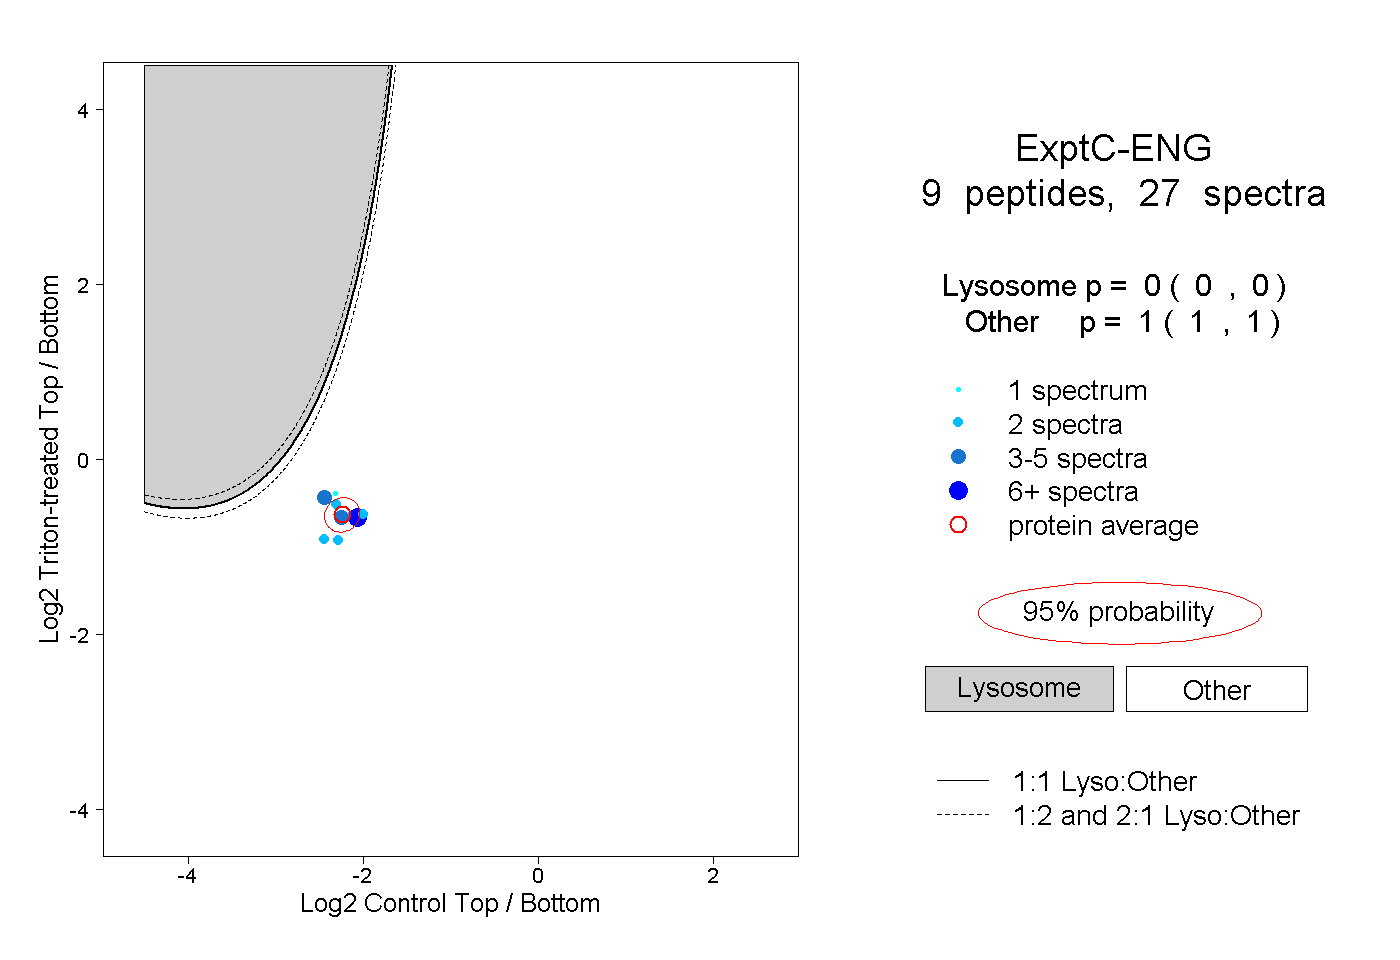
| Plot | Lyso | Other | |||||||||||
| Expt C |
9 peptides |
27 spectra |
|
0.000 0.000 | 0.000 |
1.000 1.000 | 1.000 |
| 2 spectra, VNSTPLPSFTSK | 0.000 | 1.000 | ||||||||
| 2 spectra, DMGVTLEWQPR | 0.000 | 1.000 | ||||||||
| 2 spectra, IFPENNIK | 0.000 | 1.000 | ||||||||
| 2 spectra, LNIVSPDLSGK | 0.000 | 1.000 | ||||||||
| 6 spectra, TVTVTVK | 0.000 | 1.000 | ||||||||
| 2 spectra, EAYVLR | 0.000 | 1.000 | ||||||||
| 5 spectra, FSFLLR | 0.000 | 1.000 | ||||||||
| 1 spectrum, LGQDPK | 0.000 | 1.000 | ||||||||
| 5 spectra, VGCDLQR | 0.000 | 1.000 |
| Plot | Lyso | Other | |||||||||||
| Expt D |
2 peptides |
2 spectra |
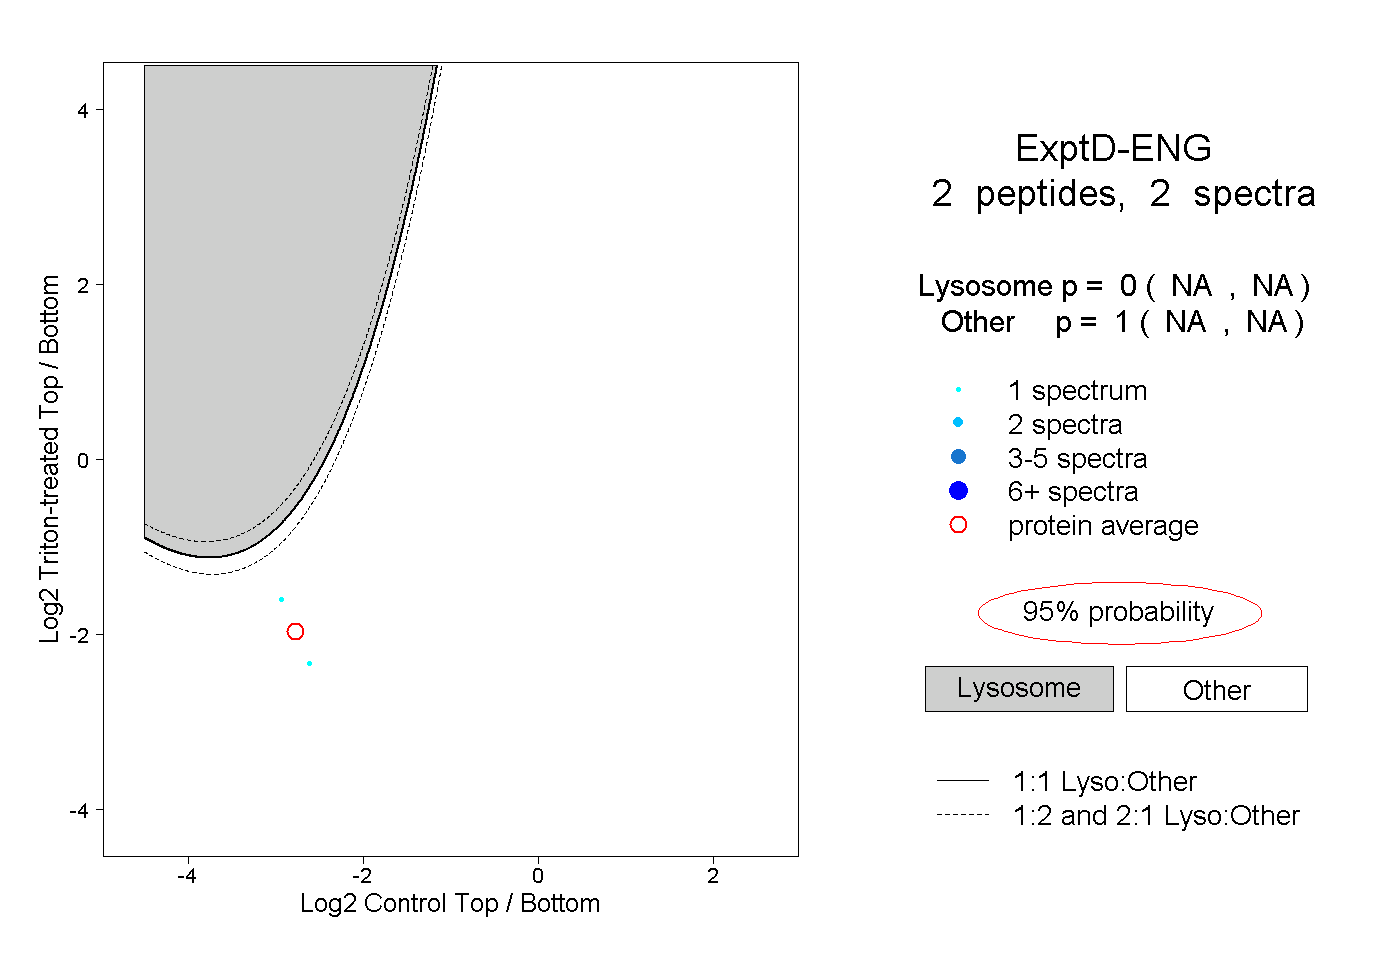 |
0.000 NA | NA |
1.000 NA | NA |