 8
8peptides
spectra
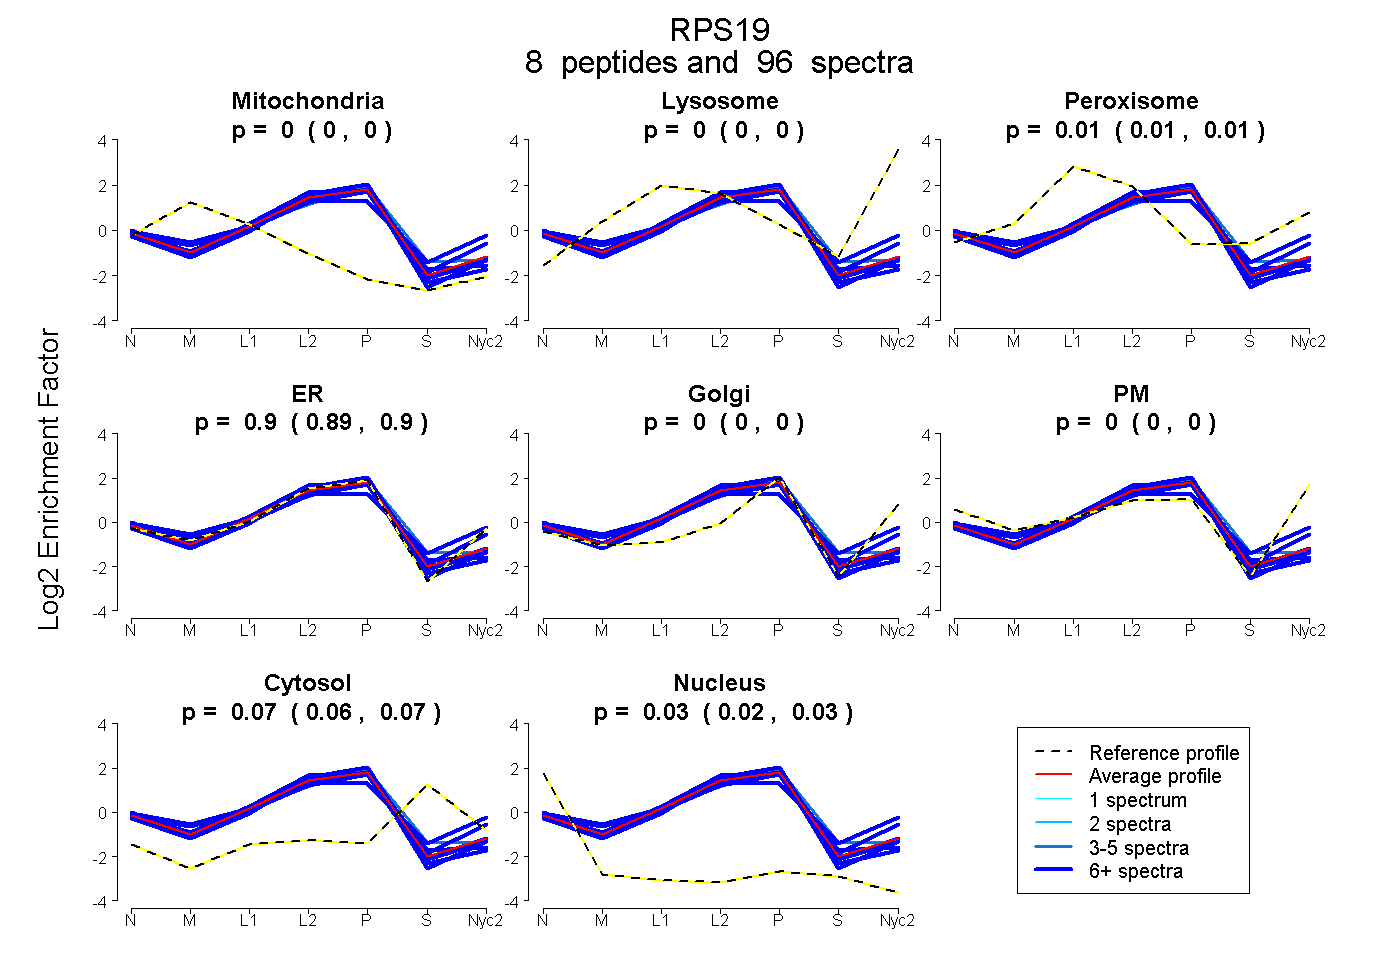
0.000 | 0.000
0.000 | 0.000
0.008 | 0.014
0.893 | 0.900
0.000 | 0.000
0.000 | 0.000
0.062 | 0.070
0.022 | 0.028
8peptides
spectra
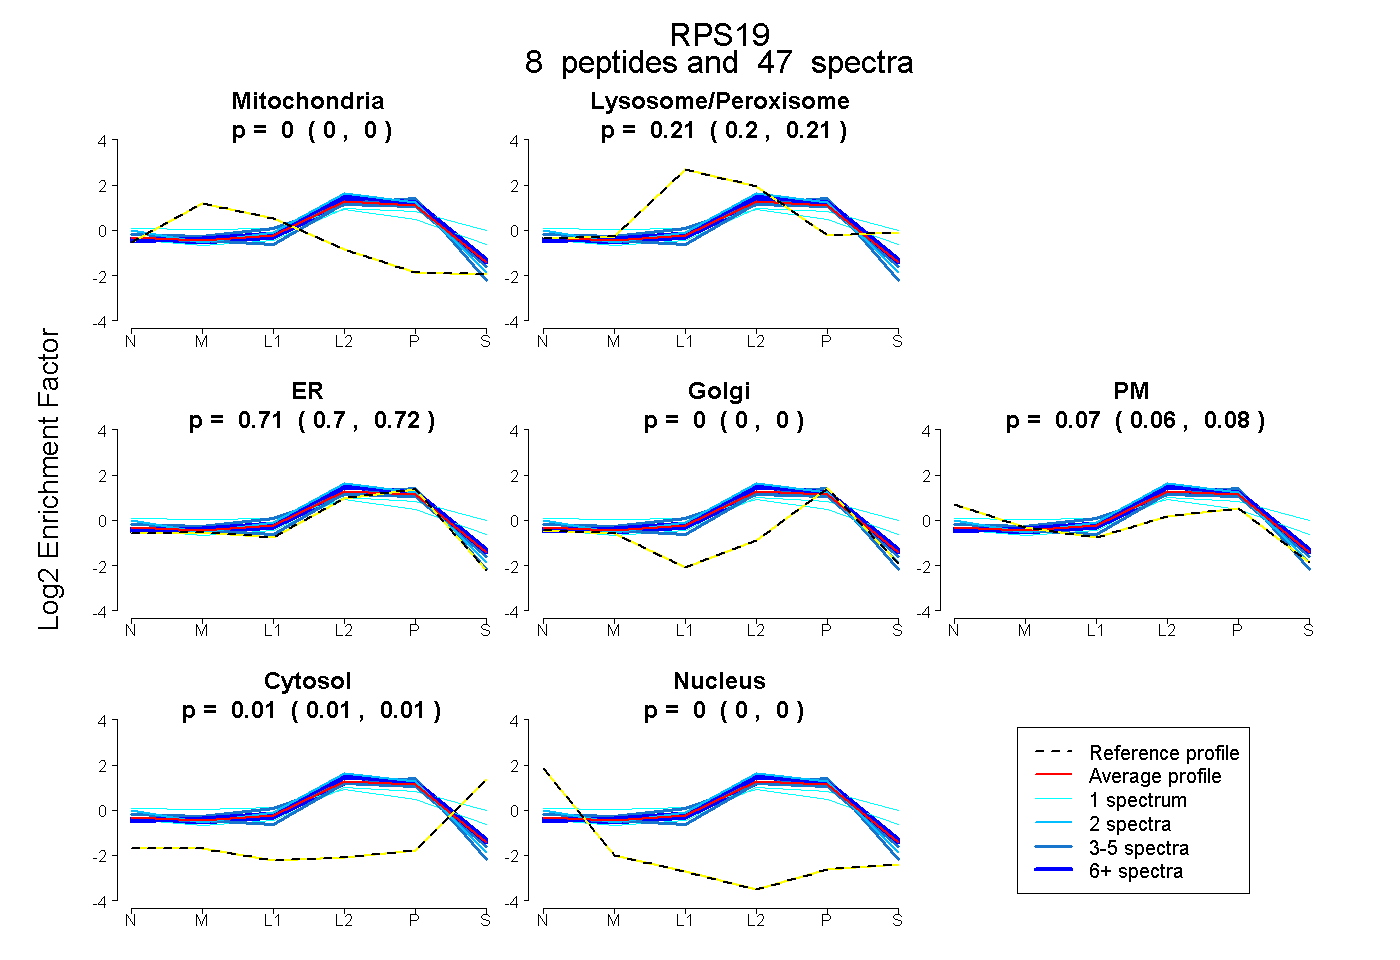
0.000 | 0.000
0.200 | 0.210
0.700 | 0.724
0.000 | 0.000
0.059 | 0.082
0.006 | 0.015
0.000 | 0.000
10peptides
spectra
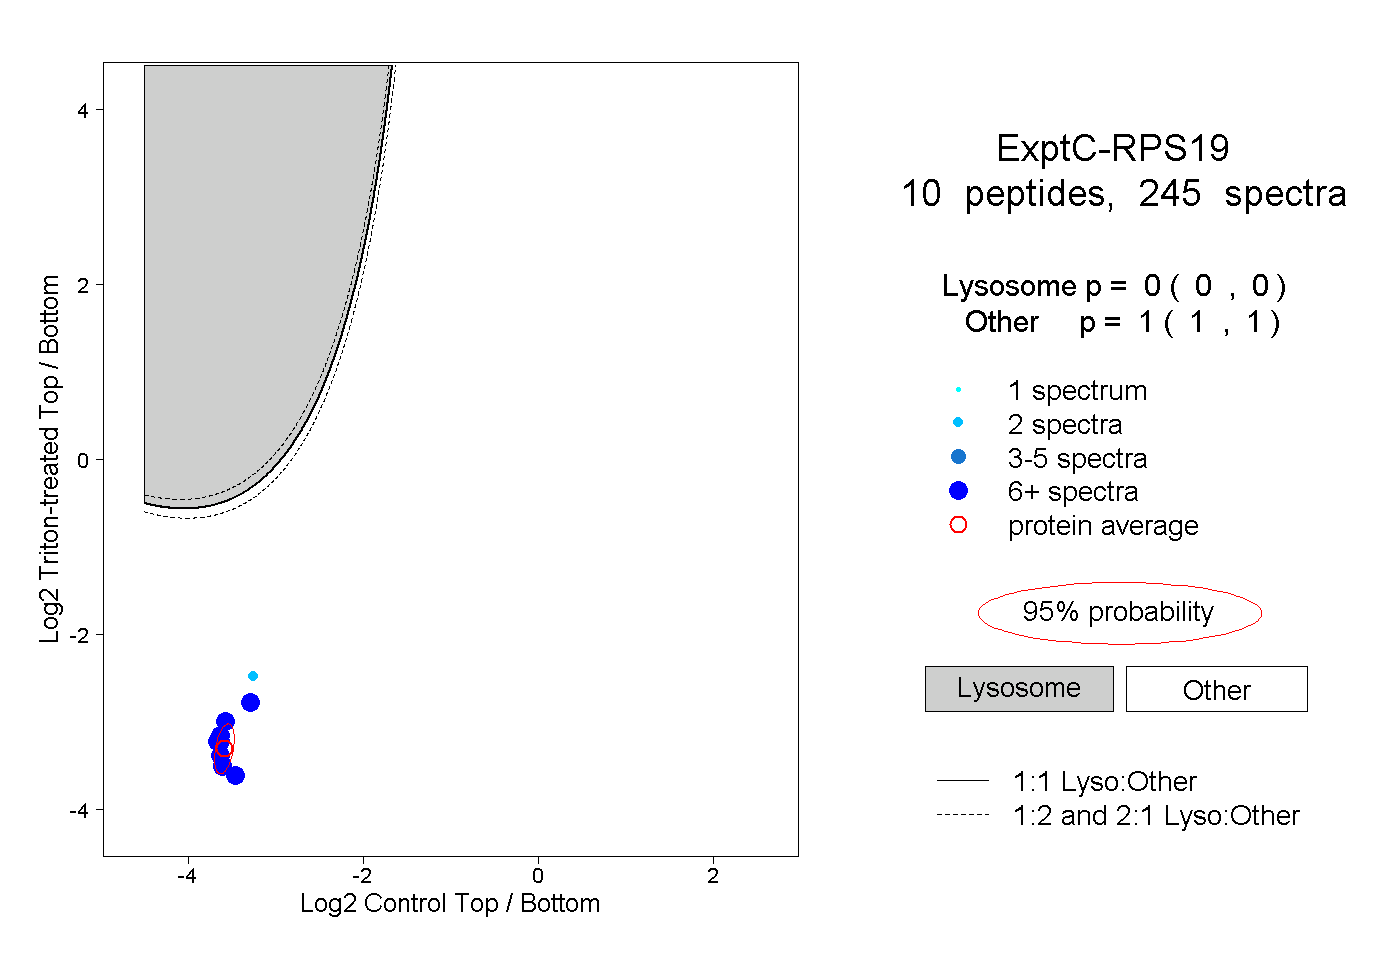
0.000 | 0.000
1.000 | 1.000
6peptides
spectra
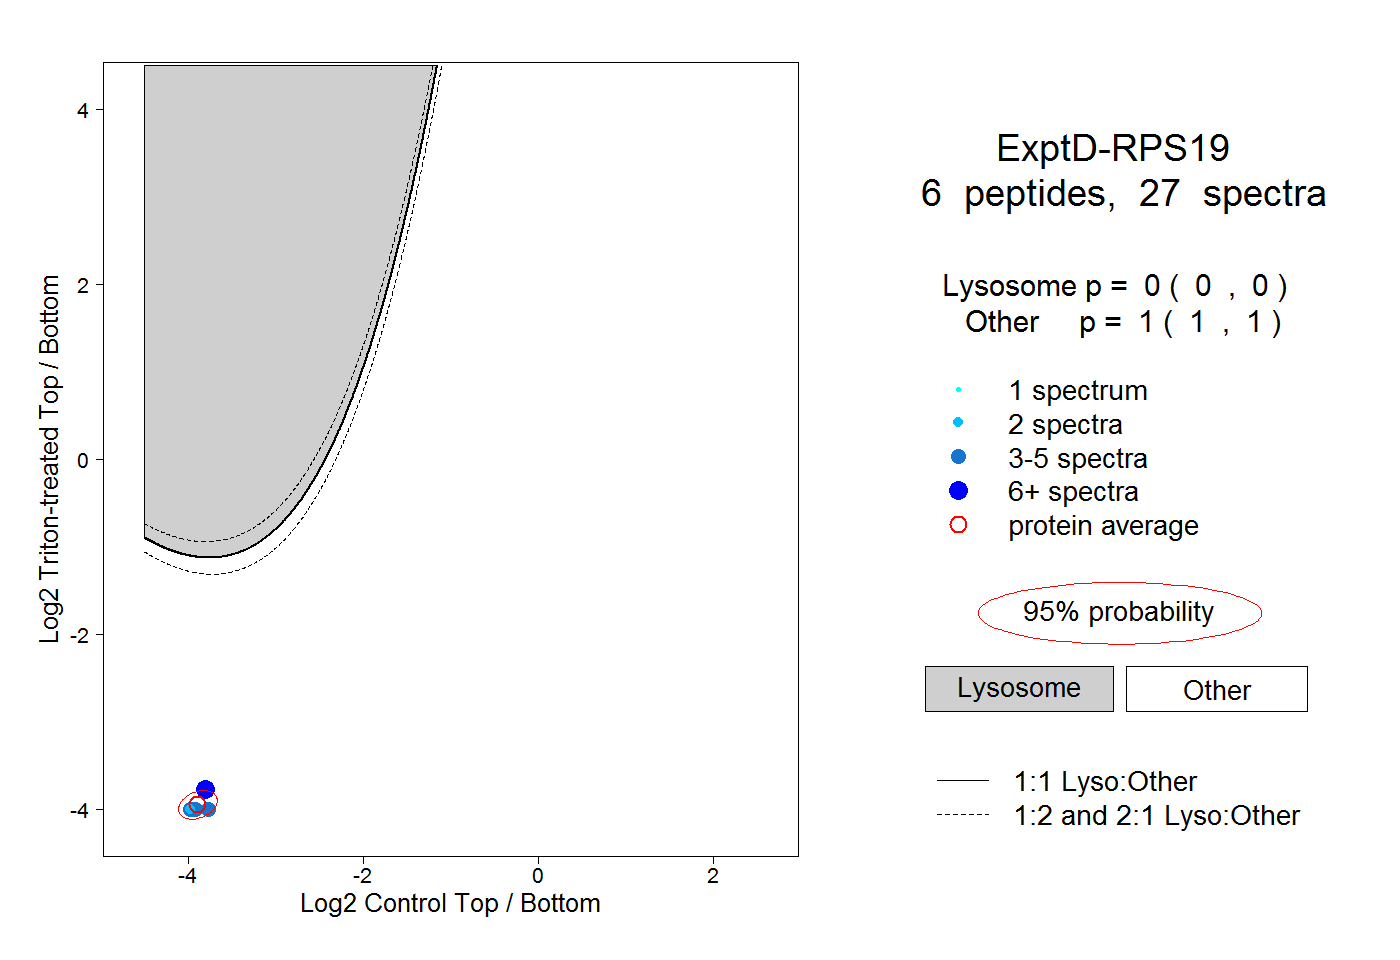
0.000 | 0.000
1.000 | 1.000