 8
8peptides
spectra
0.000 | 0.000
0.000 | 0.000
0.008 | 0.014
0.893 | 0.900
0.000 | 0.000
0.000 | 0.000
0.062 | 0.070
0.022 | 0.028
| Plot | Mito | Lyso | Perox | ER | Golgi | PM | Cytosol | Nucleus | |||||
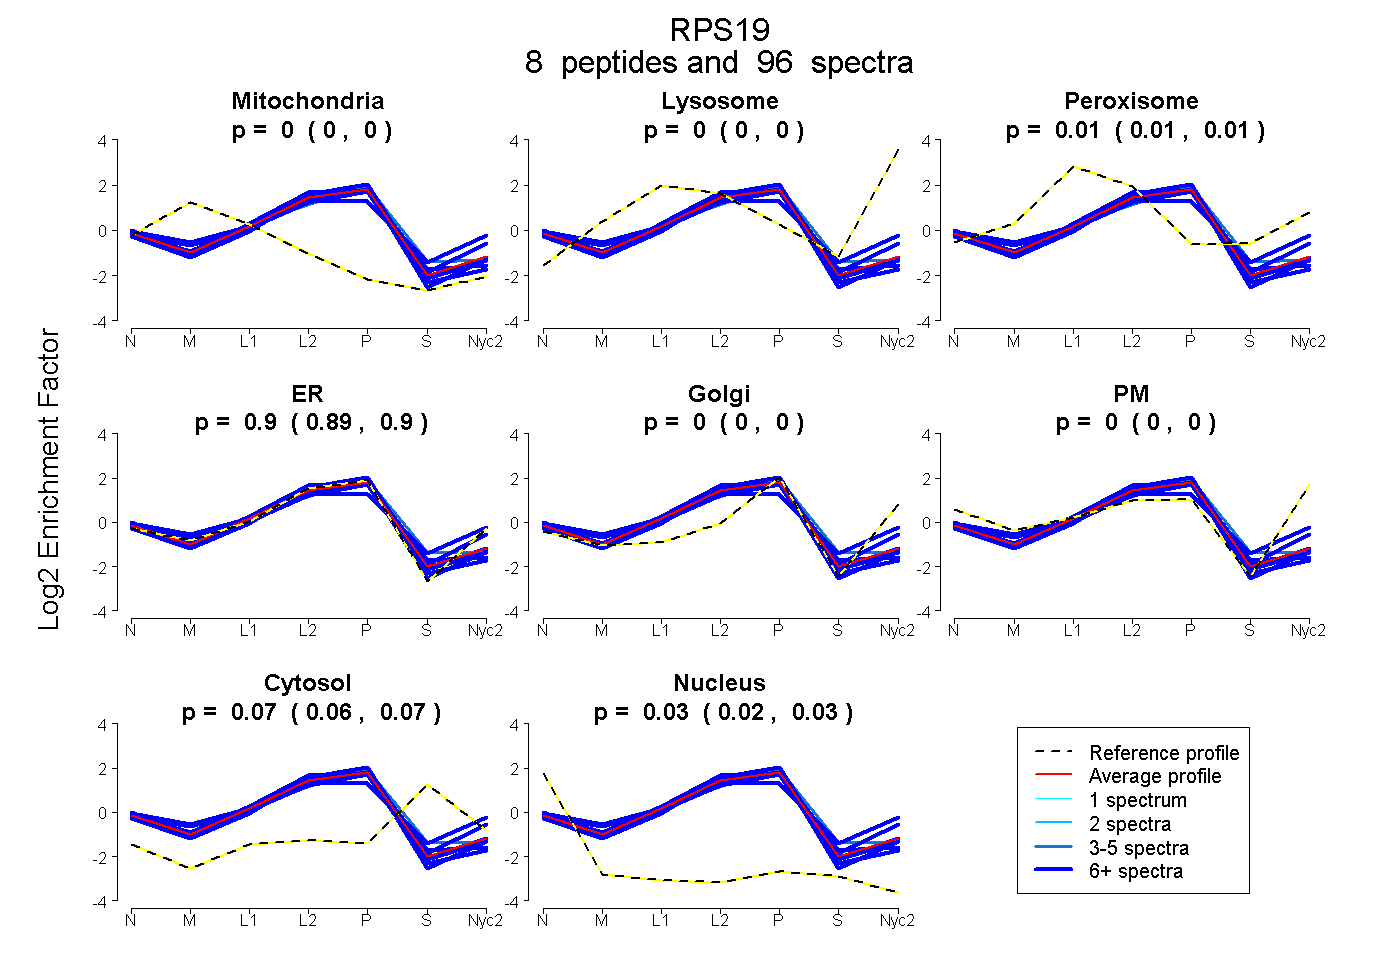
| Expt A |
8 peptides |
96 spectra |
|
0.000 0.000 | 0.000 |
0.000 0.000 | 0.000 |
0.012 0.008 | 0.014 |
0.897 0.893 | 0.900 |
0.000 0.000 | 0.000 |
0.000 0.000 | 0.000 |
0.066 0.062 | 0.070 |
0.025 0.022 | 0.028 |
| 16 spectra, VLQALEGLK | 0.000 | 0.000 | 0.020 | 0.870 | 0.000 | 0.000 | 0.096 | 0.014 | ||
| 11 spectra, DVNQQEFVR | 0.000 | 0.000 | 0.000 | 0.924 | 0.000 | 0.000 | 0.059 | 0.017 | ||
| 4 spectra, ELAPYDENWFYTR | 0.000 | 0.000 | 0.000 | 0.830 | 0.000 | 0.000 | 0.170 | 0.000 | ||
| 17 spectra, LTPQGQR | 0.000 | 0.000 | 0.000 | 0.924 | 0.000 | 0.000 | 0.044 | 0.032 | ||
| 19 spectra, GGAGVGSMTK | 0.000 | 0.000 | 0.027 | 0.881 | 0.000 | 0.000 | 0.092 | 0.000 | ||
| 6 spectra, IAGQVAAANK | 0.000 | 0.000 | 0.162 | 0.680 | 0.000 | 0.034 | 0.124 | 0.000 | ||
| 7 spectra, VSEWVDTVK | 0.082 | 0.000 | 0.000 | 0.857 | 0.000 | 0.000 | 0.000 | 0.061 | ||
| 16 spectra, ALAAFLK | 0.011 | 0.000 | 0.000 | 0.946 | 0.000 | 0.000 | 0.000 | 0.043 |
| Plot | Mito | Lyso or Perox | ER | Golgi | PM | Cytosol | Nucleus | ||||||
| Expt B |
8 peptides |
47 spectra |
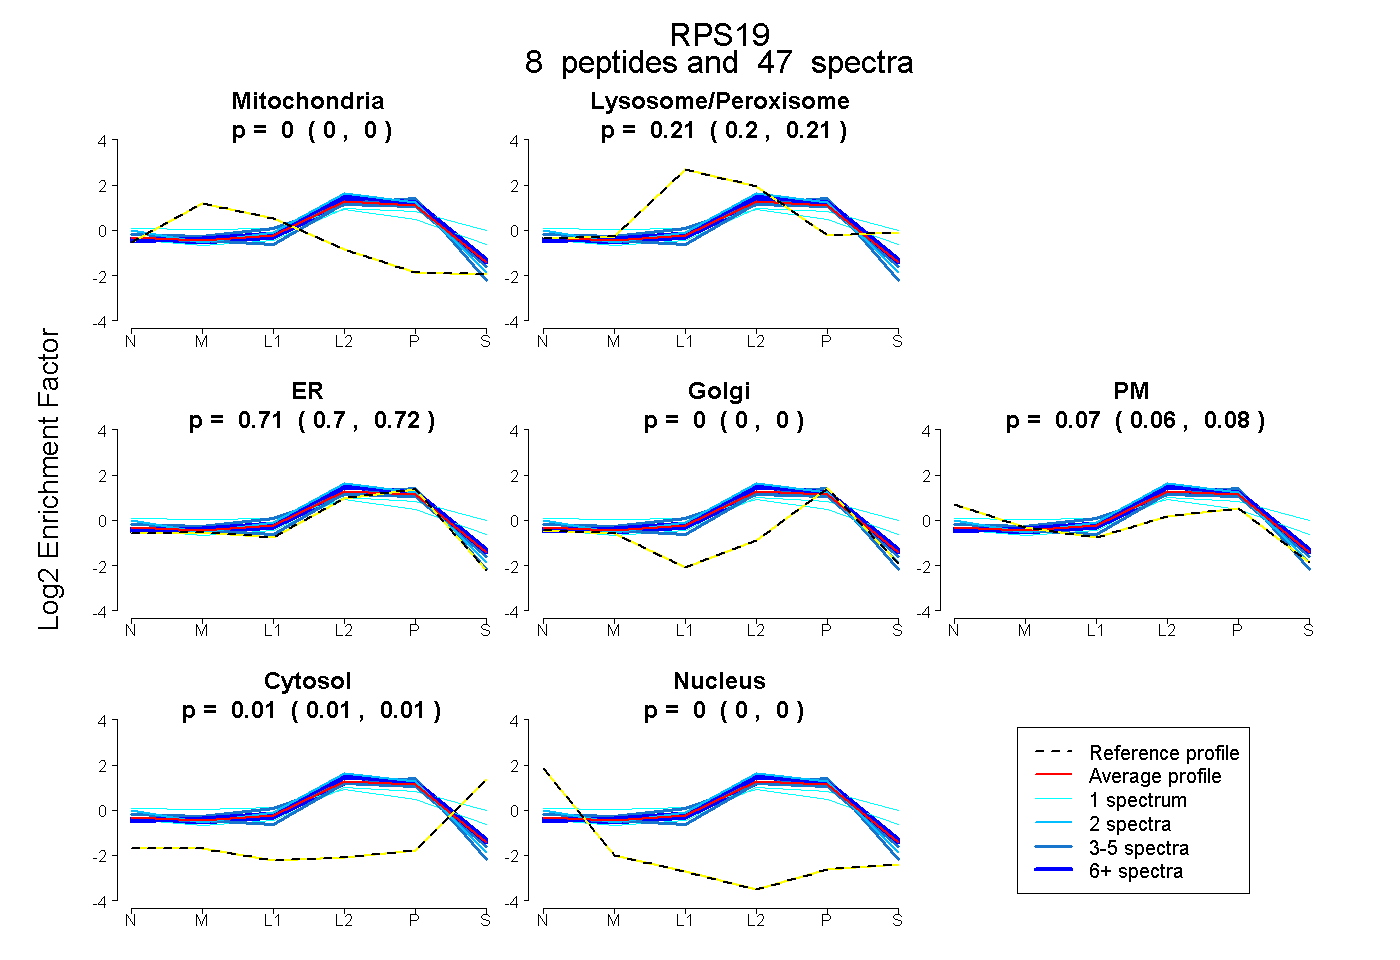 |
0.000 0.000 | 0.000 |
0.205 0.200 | 0.210 |
0.713 0.700 | 0.724 |
0.000 0.000 | 0.000 |
0.071 0.059 | 0.082 |
0.011 0.006 | 0.015 |
0.000 0.000 | 0.000 |
|||
| Plot | Lyso | Other | |||||||||||
| Expt C |
10 peptides |
245 spectra |
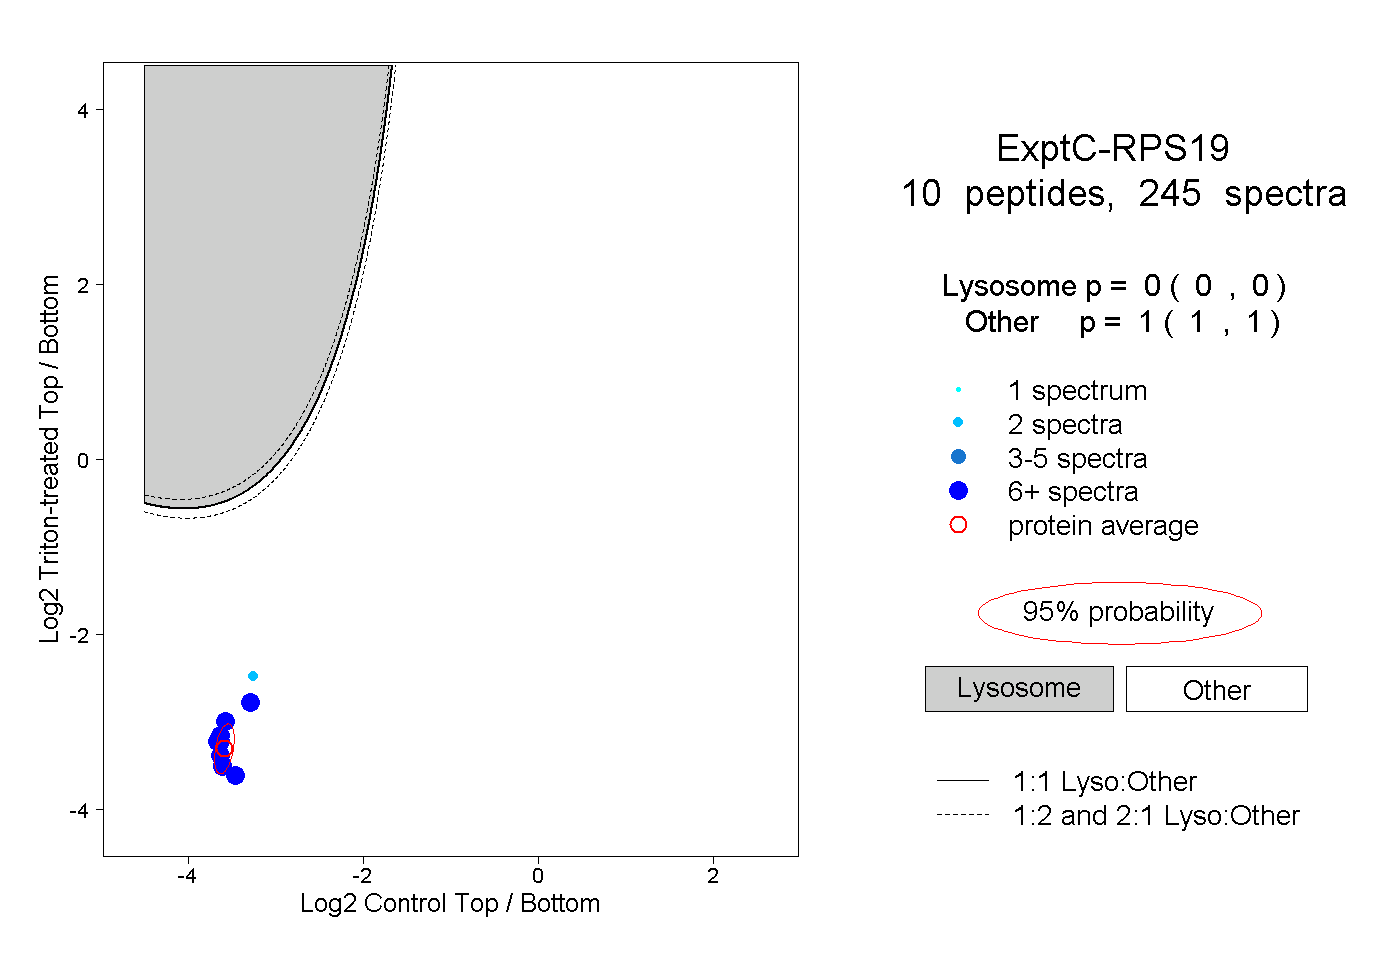 |
0.000 0.000 | 0.000 |
1.000 1.000 | 1.000 |
||||||||
| Plot | Lyso | Other | |||||||||||
| Expt D |
6 peptides |
27 spectra |
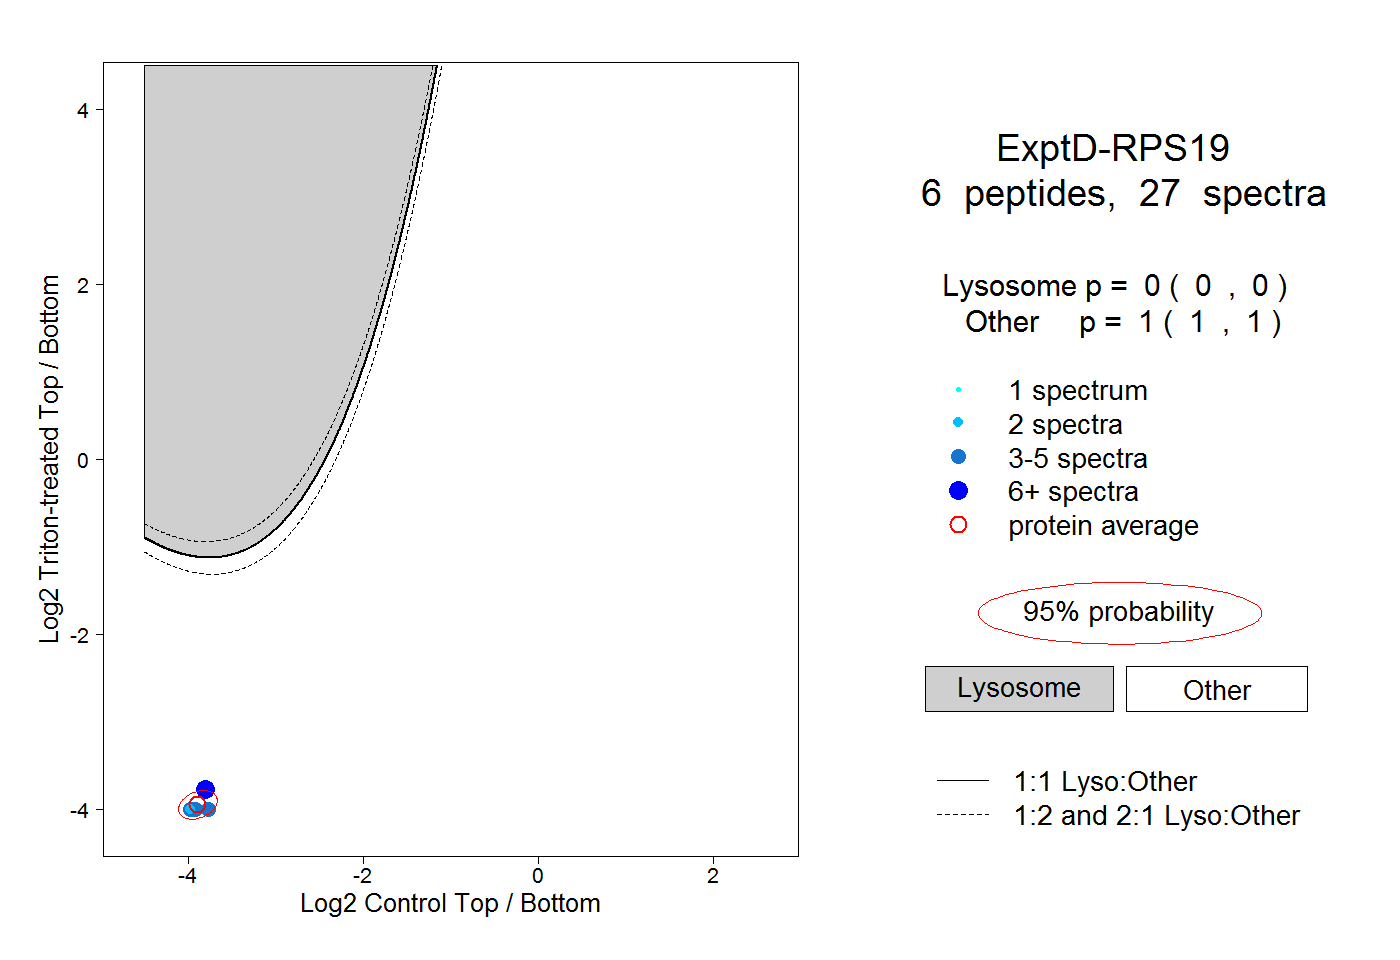 |
0.000 0.000 | 0.000 |
1.000 1.000 | 1.000 |