 8
8peptides
spectra
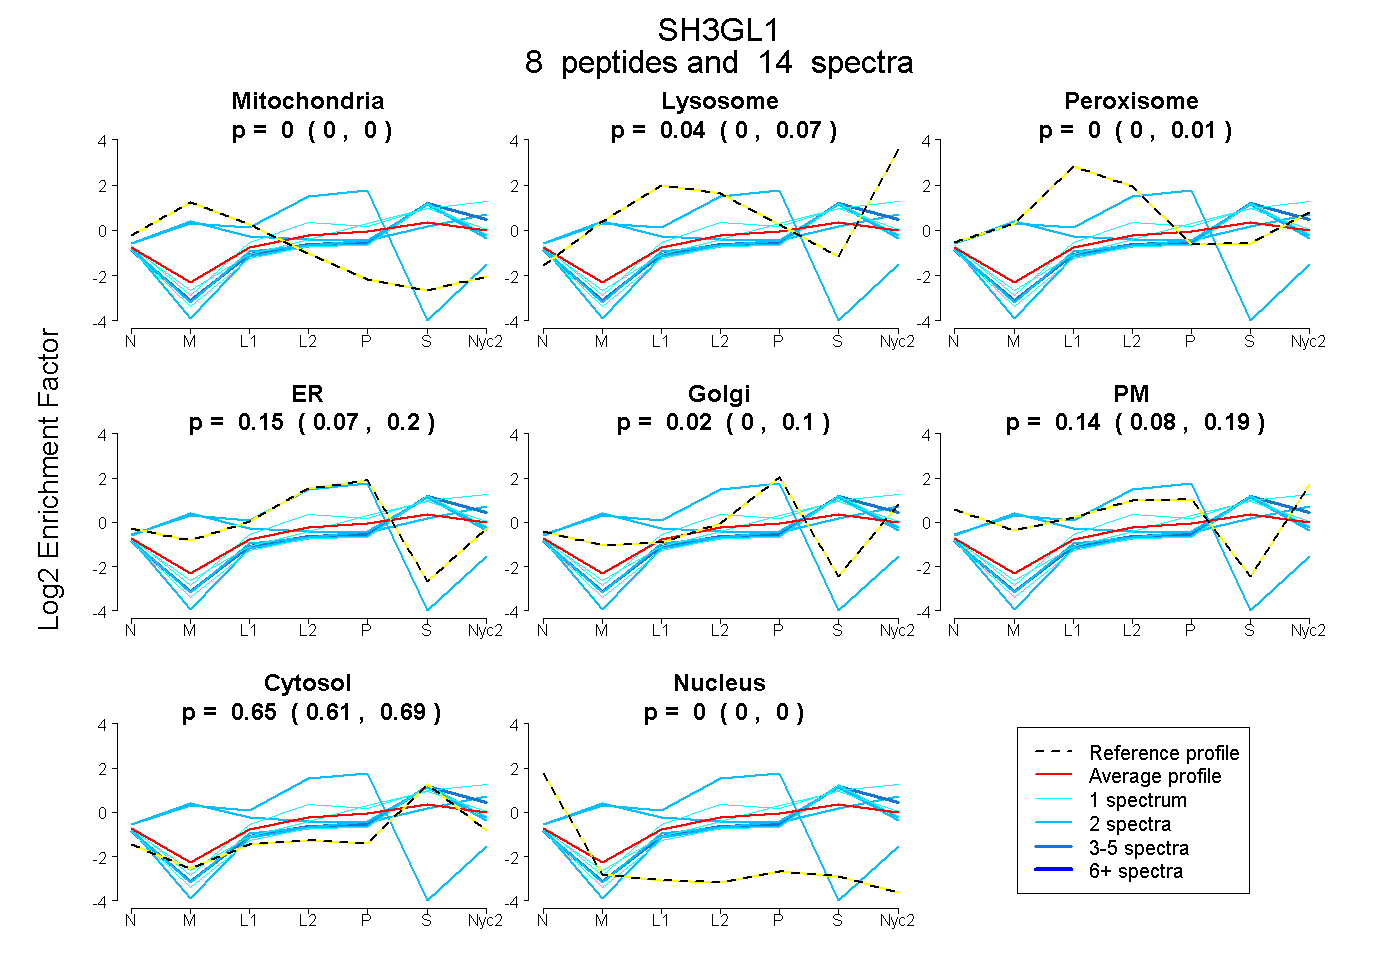
0.000 | 0.000
0.003 | 0.065
0.000 | 0.010
0.067 | 0.200
0.000 | 0.095
0.084 | 0.188
0.607 | 0.686
0.000 | 0.000
3peptides
spectra
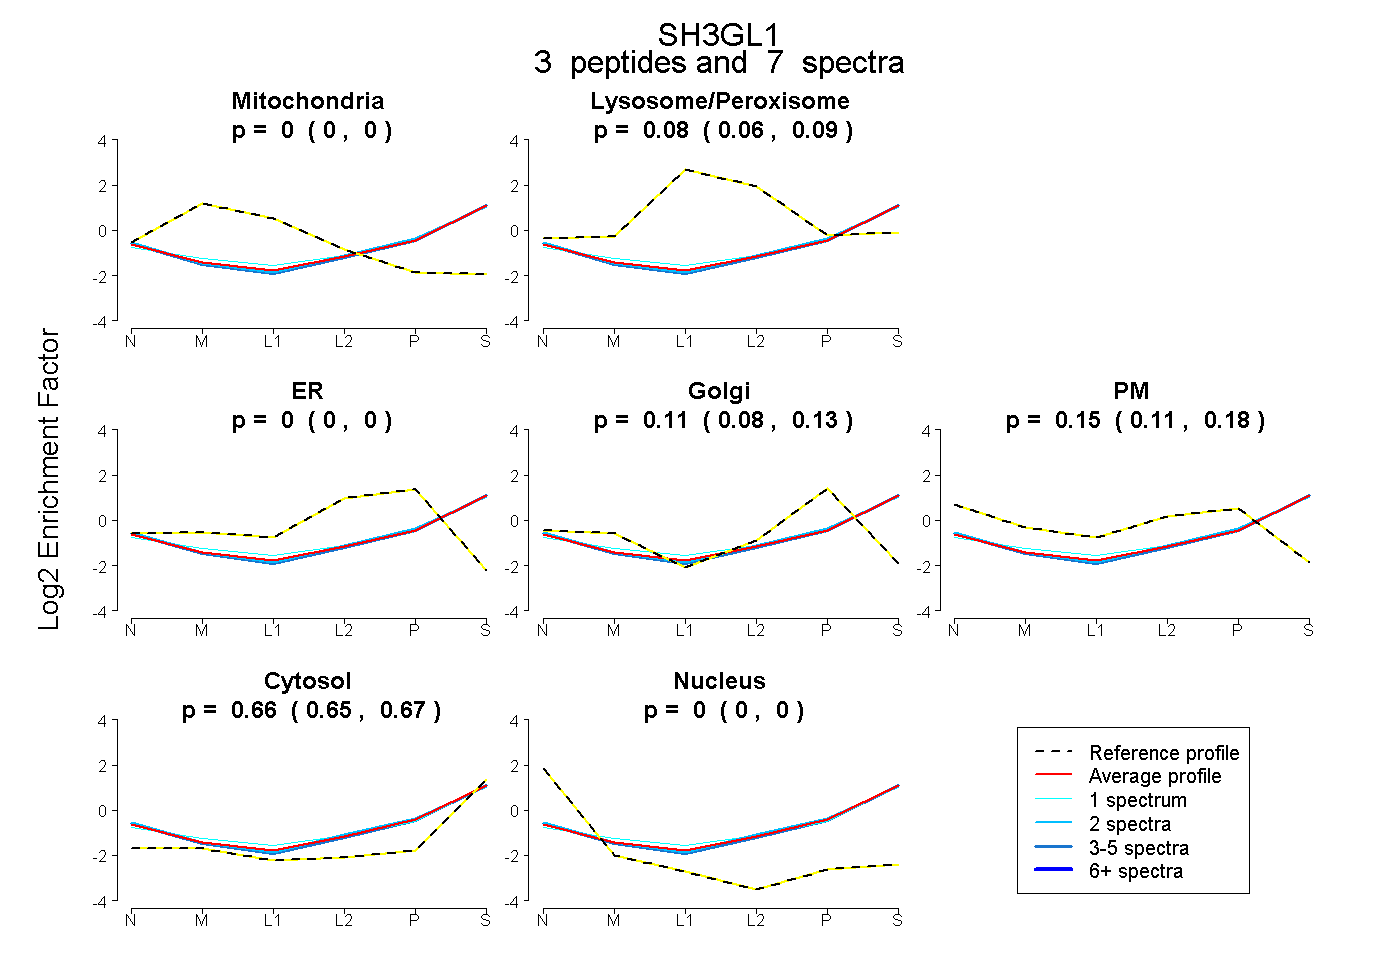
0.000 | 0.000
0.061 | 0.093
0.000 | 0.000
0.082 | 0.132
0.113 | 0.183
0.655 | 0.667
0.000 | 0.000
9peptides
spectra
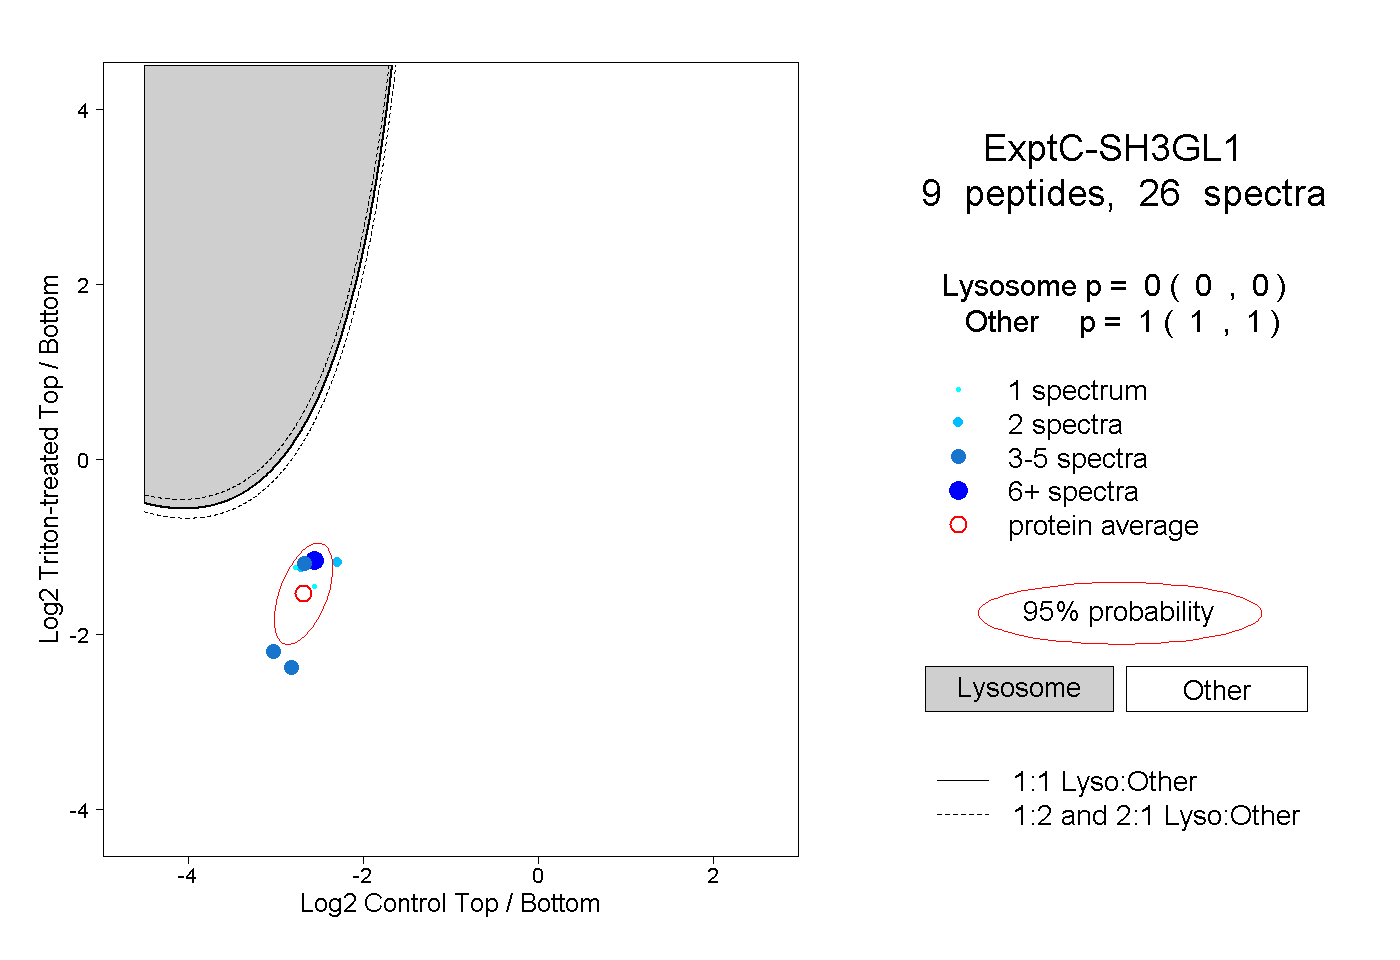
0.000 | 0.000
1.000 | 1.000
1peptide
spectrum
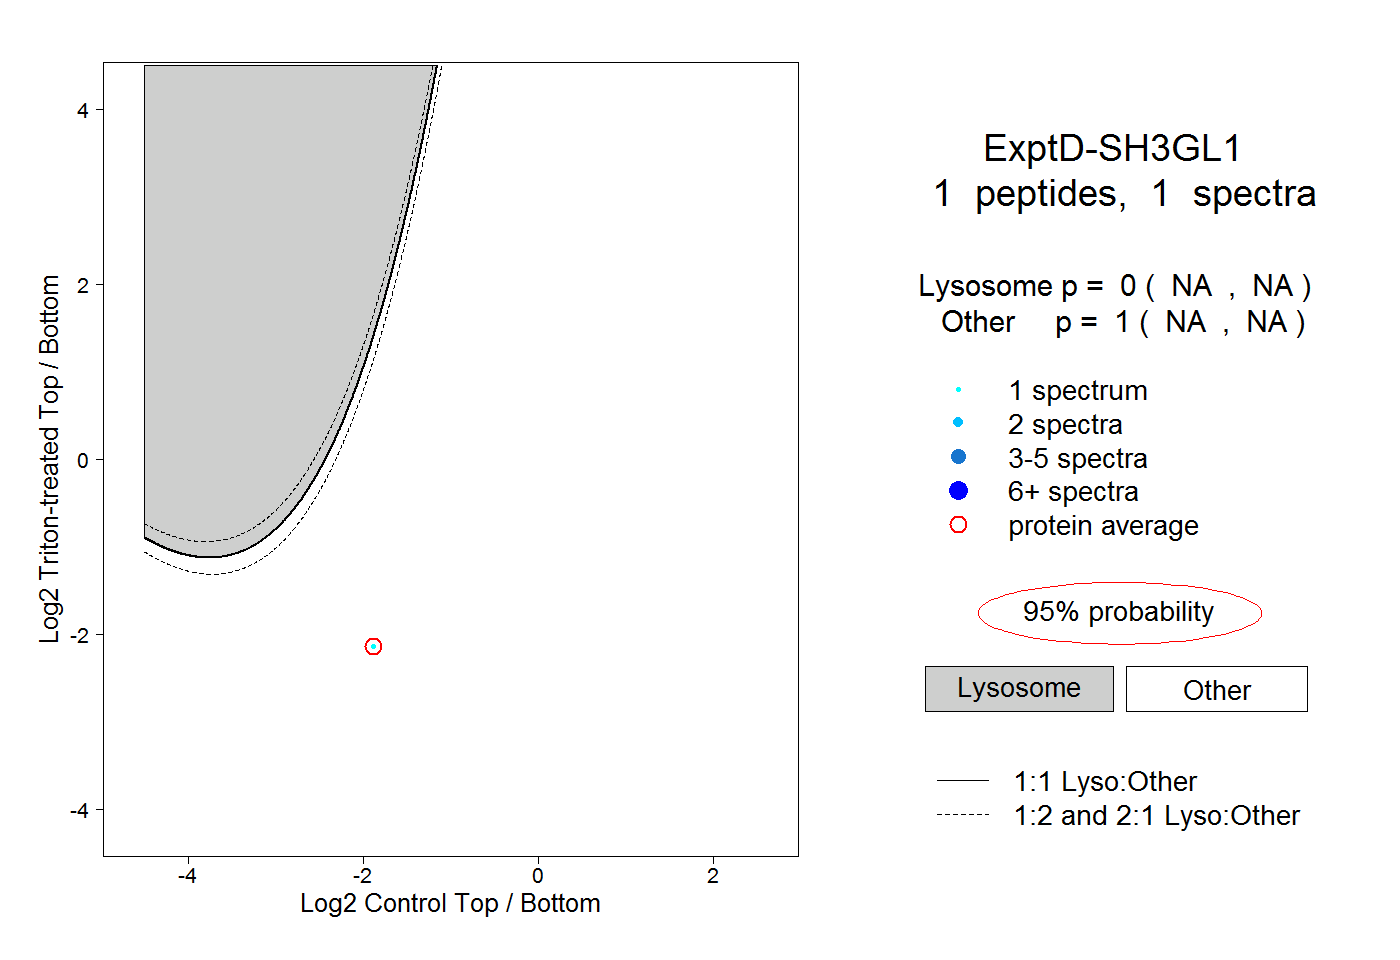
NA | NA
NA | NA