 8
8peptides
spectra
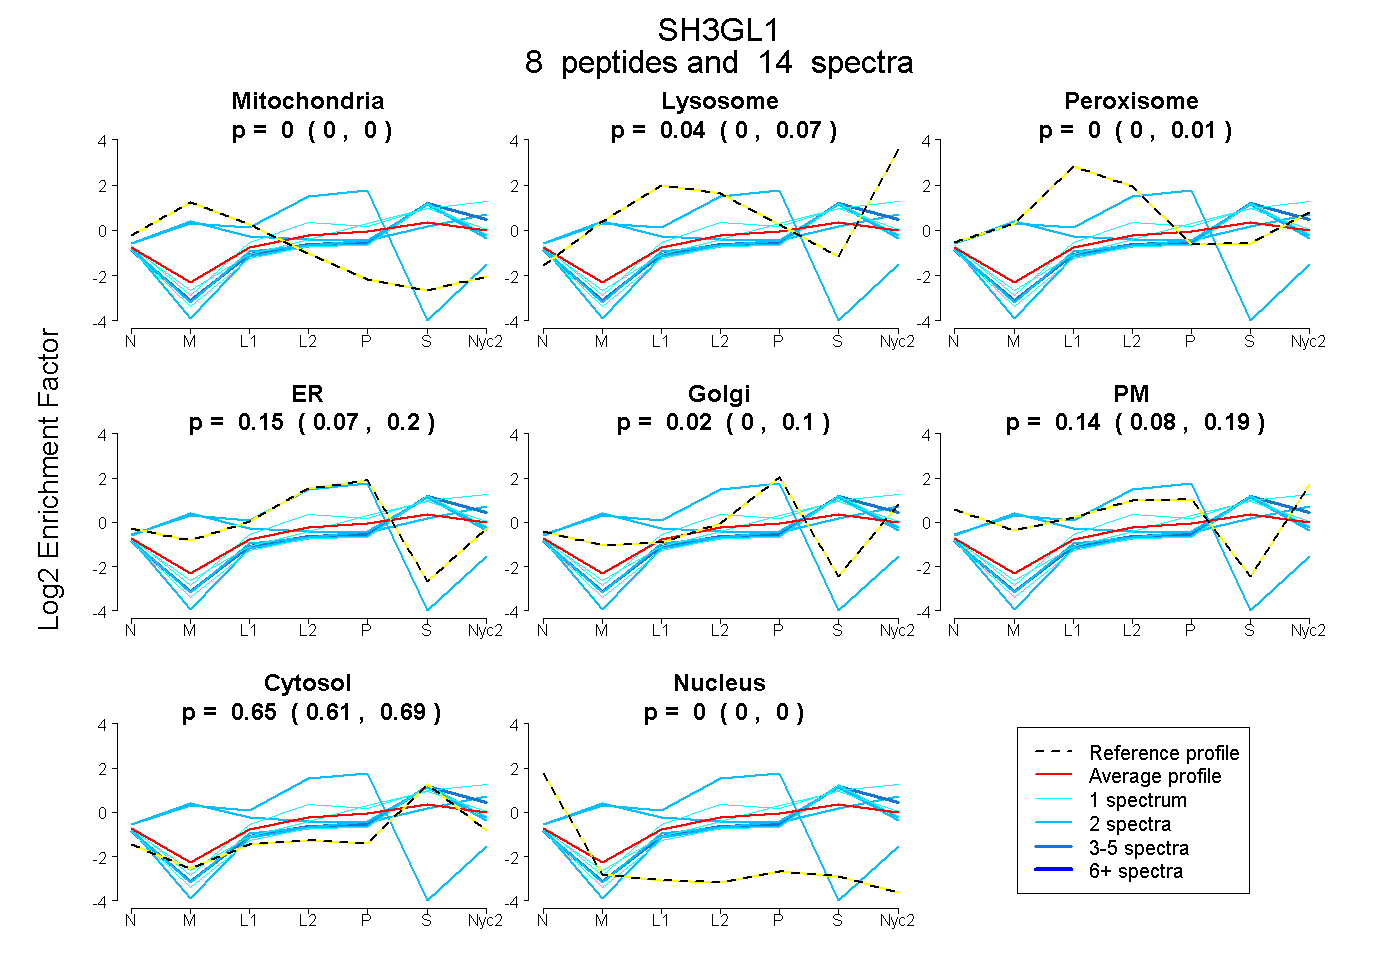
0.000 | 0.000
0.003 | 0.065
0.000 | 0.010
0.067 | 0.200
0.000 | 0.095
0.084 | 0.188
0.607 | 0.686
0.000 | 0.000
| Plot | Mito | Lyso | Perox | ER | Golgi | PM | Cytosol | Nucleus | |||||
| Expt A |
8 peptides |
14 spectra |
|
0.000 0.000 | 0.000 |
0.035 0.003 | 0.065 |
0.000 0.000 | 0.010 |
0.147 0.067 | 0.200 |
0.022 0.000 | 0.095 |
0.144 0.084 | 0.188 |
0.652 0.607 | 0.686 |
0.000 0.000 | 0.000 |
| 1 spectrum, LTMLNTVSK | 0.000 | 0.040 | 0.000 | 0.024 | 0.245 | 0.000 | 0.691 | 0.000 | ||
| 1 spectrum, ITASSSFR | 0.000 | 0.232 | 0.000 | 0.000 | 0.034 | 0.119 | 0.615 | 0.000 | ||
| 3 spectra, AVAEVLVR | 0.000 | 0.084 | 0.000 | 0.000 | 0.019 | 0.079 | 0.818 | 0.000 | ||
| 2 spectra, VDITSK | 0.169 | 0.000 | 0.000 | 0.831 | 0.000 | 0.000 | 0.000 | 0.000 | ||
| 2 spectra, IPDEELR | 0.000 | 0.000 | 0.000 | 0.000 | 0.059 | 0.038 | 0.903 | 0.000 | ||
| 2 spectra, EIQHHLK | 0.000 | 0.000 | 0.000 | 0.076 | 0.005 | 0.067 | 0.851 | 0.000 | ||
| 1 spectrum, TIEYLQPNPASR | 0.000 | 0.000 | 0.000 | 0.000 | 0.033 | 0.074 | 0.893 | 0.000 | ||
| 2 spectra, ASQLVSEK | 0.204 | 0.317 | 0.000 | 0.000 | 0.000 | 0.094 | 0.385 | 0.000 |
| Plot | Mito | Lyso or Perox | ER | Golgi | PM | Cytosol | Nucleus | ||||||
| Expt B |
3 peptides |
7 spectra |
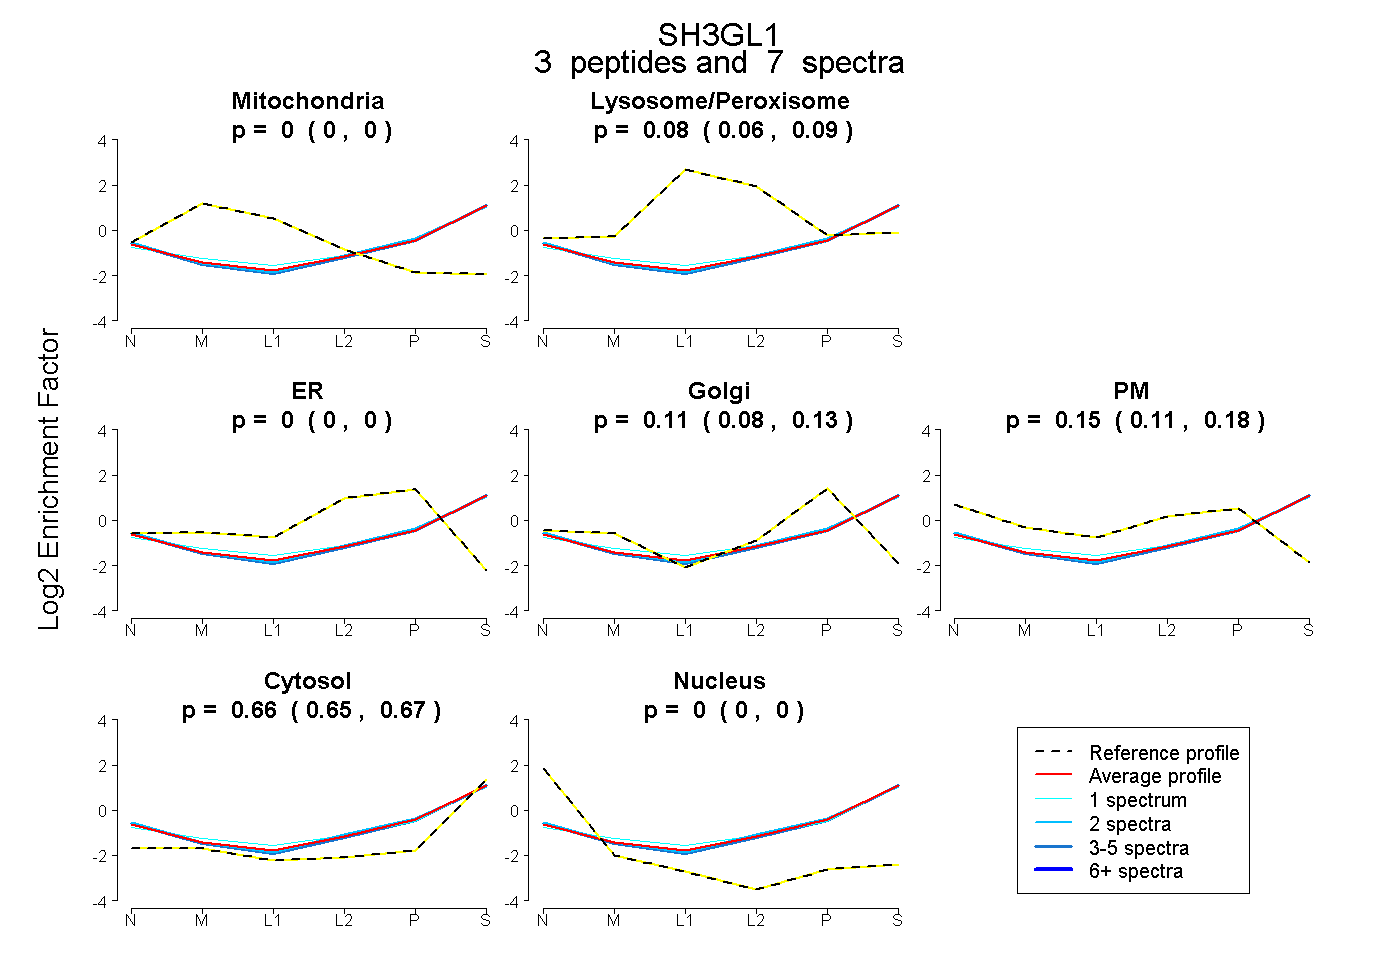 |
0.000 0.000 | 0.000 |
0.078 0.061 | 0.093 |
0.000 0.000 | 0.000 |
0.108 0.082 | 0.132 |
0.152 0.113 | 0.183 |
0.661 0.655 | 0.667 |
0.000 0.000 | 0.000 |
|||
| Plot | Lyso | Other | |||||||||||
| Expt C |
9 peptides |
26 spectra |
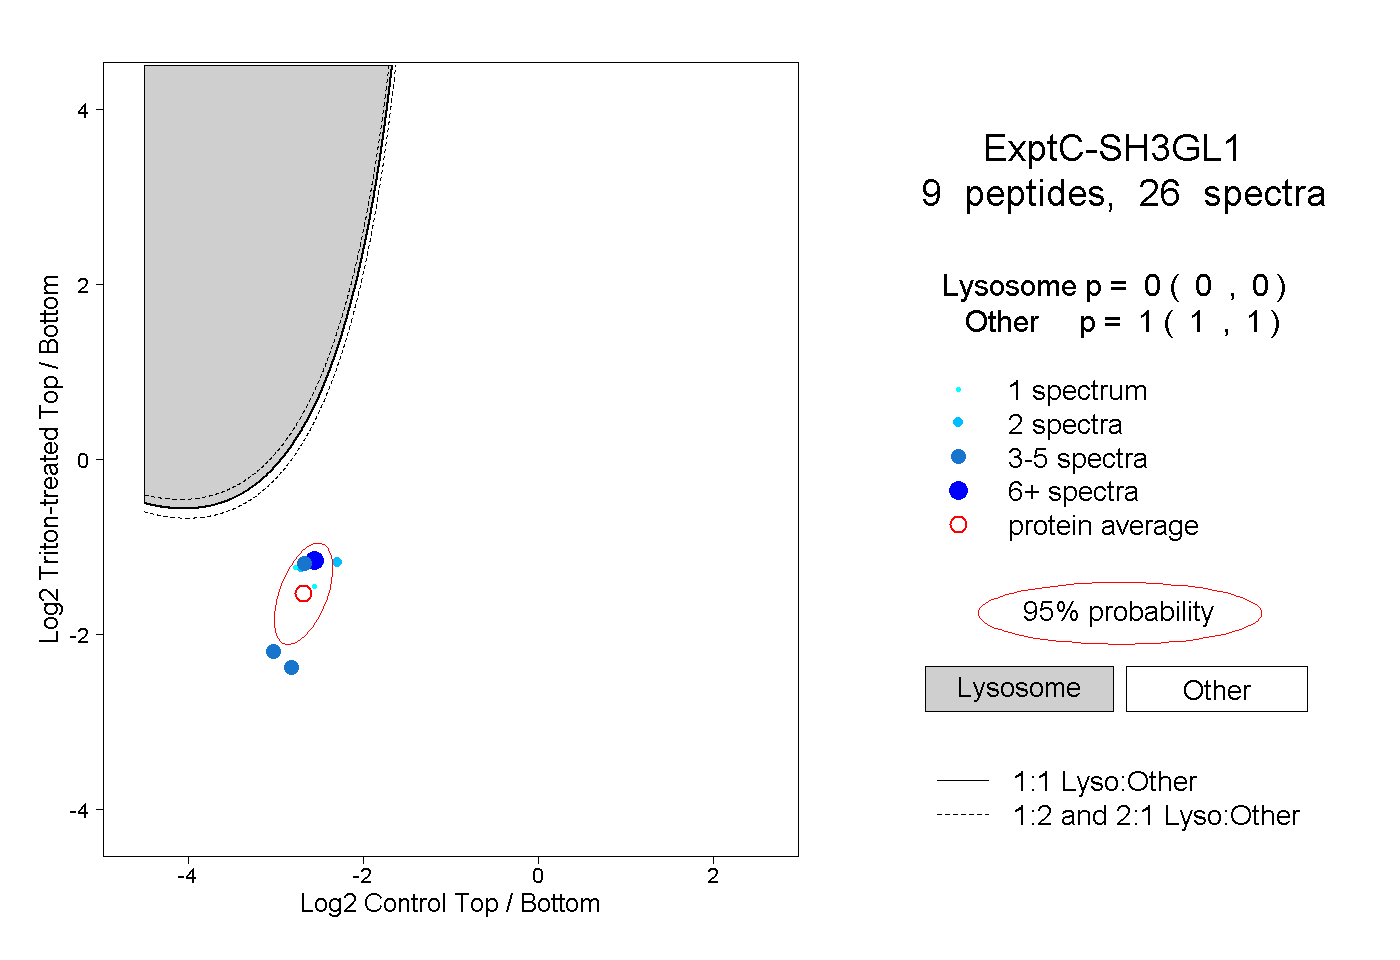 |
0.000 0.000 | 0.000 |
1.000 1.000 | 1.000 |
||||||||
| Plot | Lyso | Other | |||||||||||
| Expt D |
1 peptide |
1 spectrum |
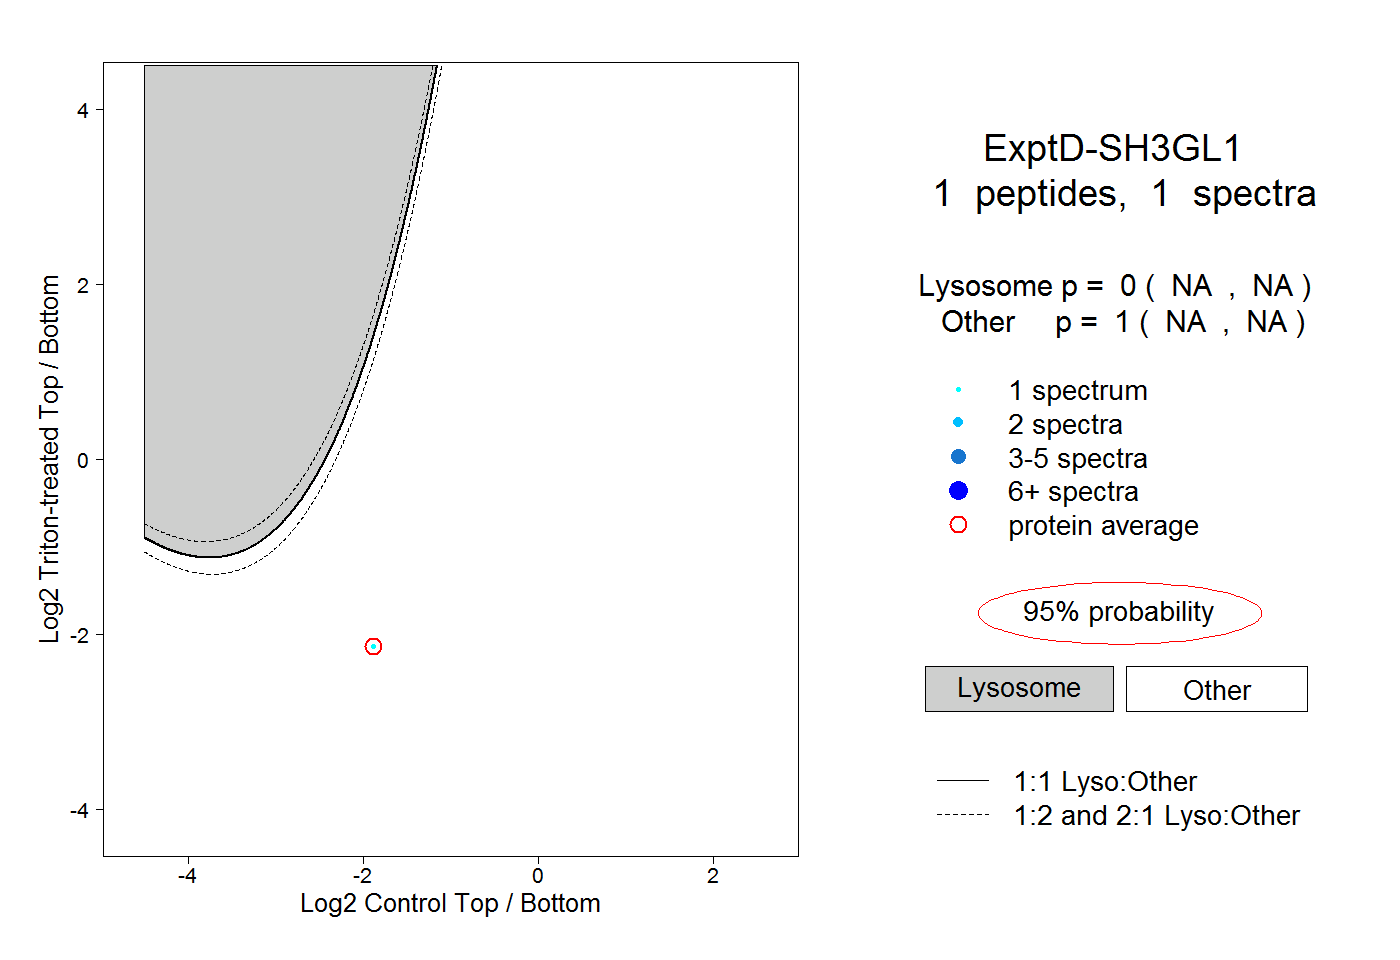 |
0.000 NA | NA |
1.000 NA | NA |