 17
17peptides
spectra
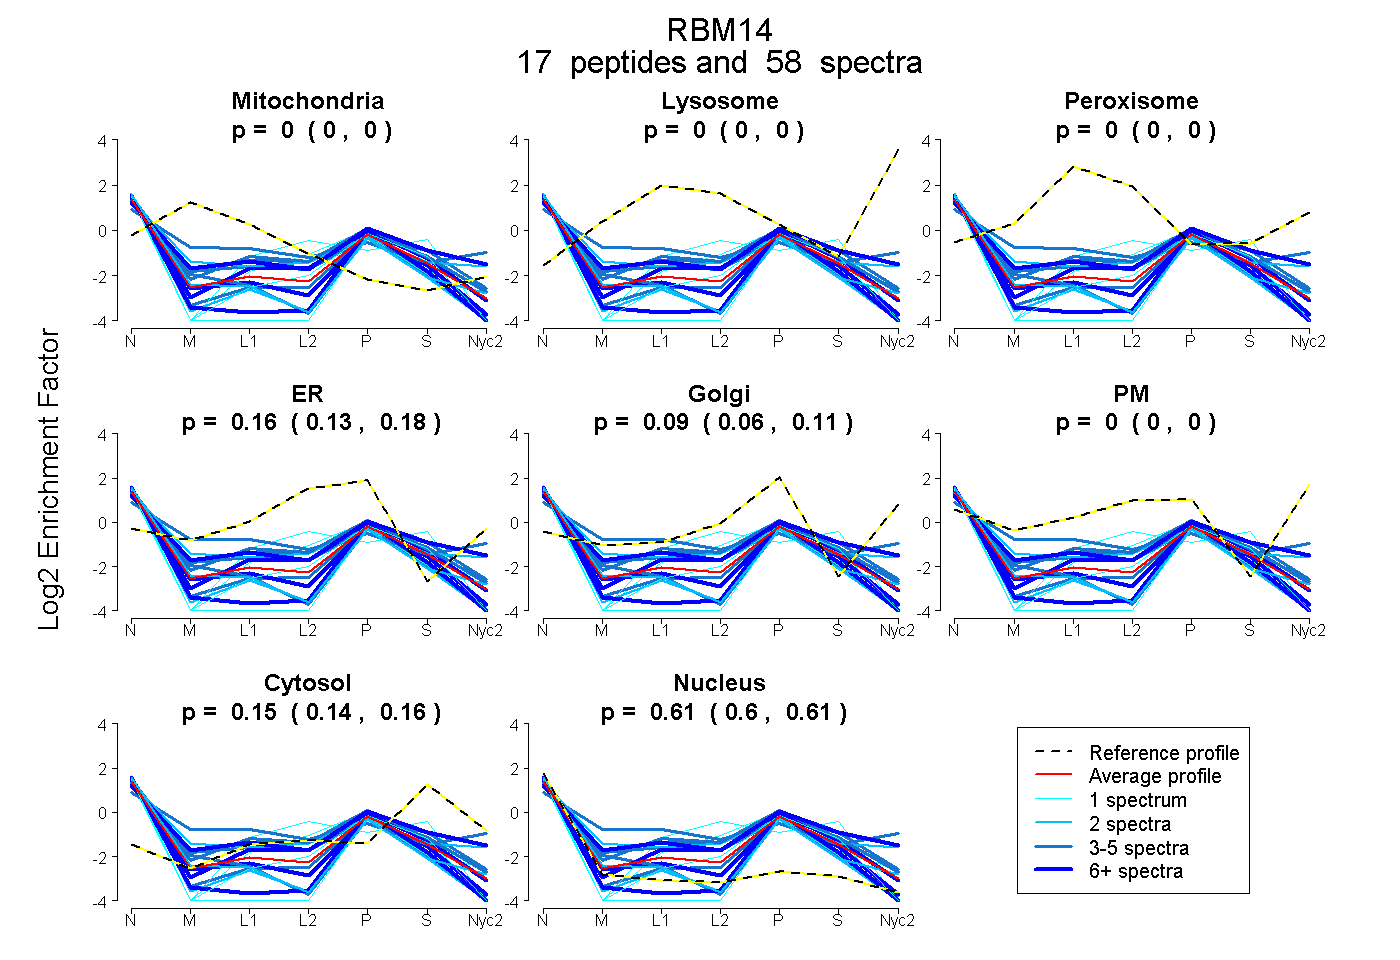
0.000 | 0.000
0.000 | 0.000
0.000 | 0.000
0.128 | 0.180
0.058 | 0.111
0.000 | 0.000
0.144 | 0.155
0.602 | 0.613
5peptides
spectra
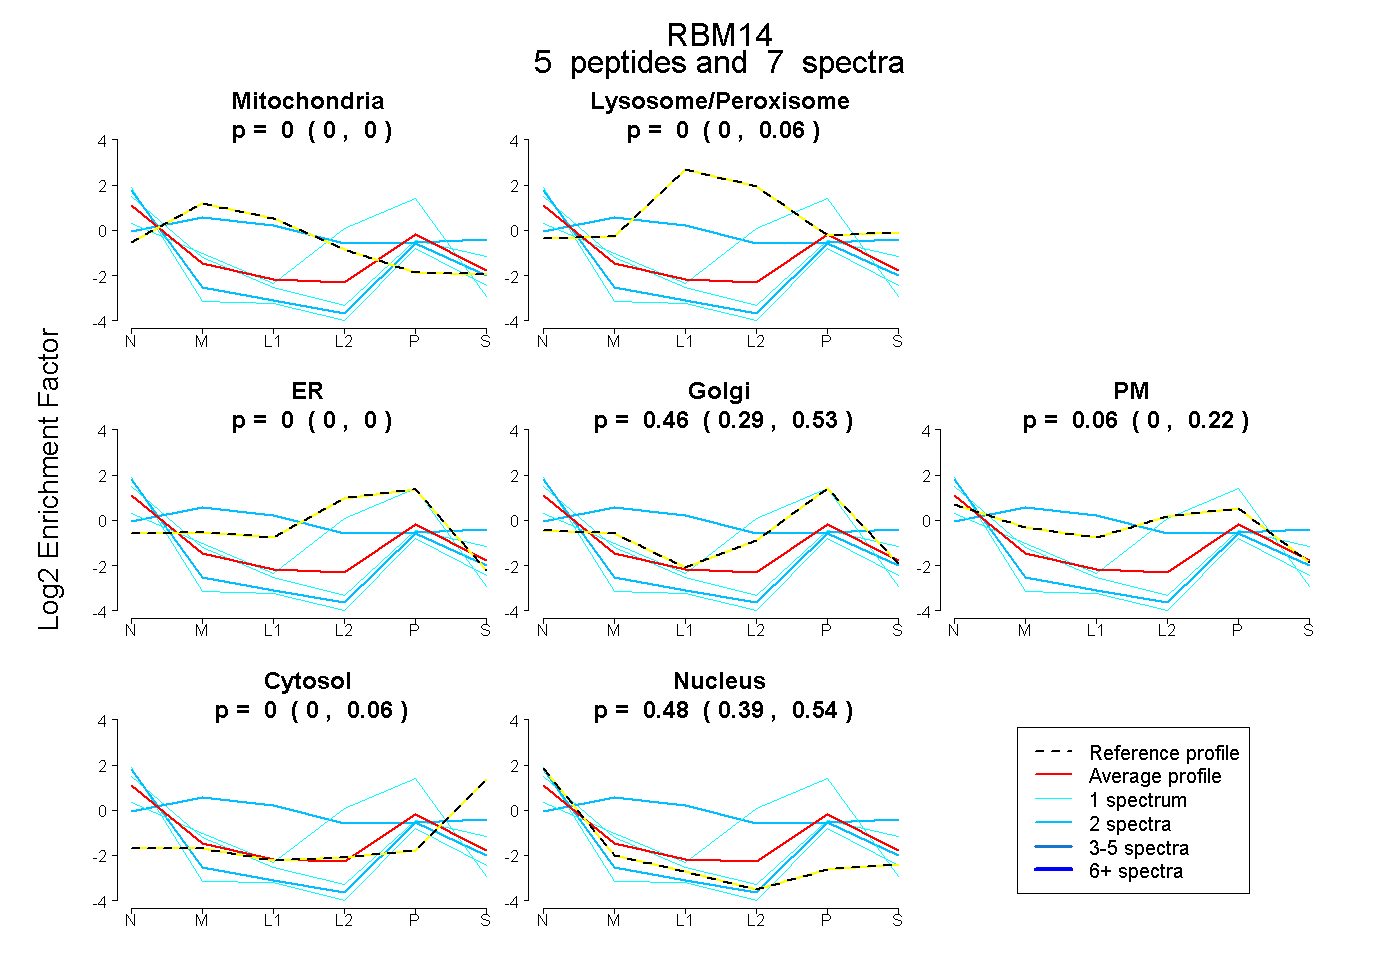
0.000 | 0.000
0.000 | 0.056
0.000 | 0.000
0.287 | 0.535
0.000 | 0.219
0.000 | 0.064
0.388 | 0.540
2peptides
spectra
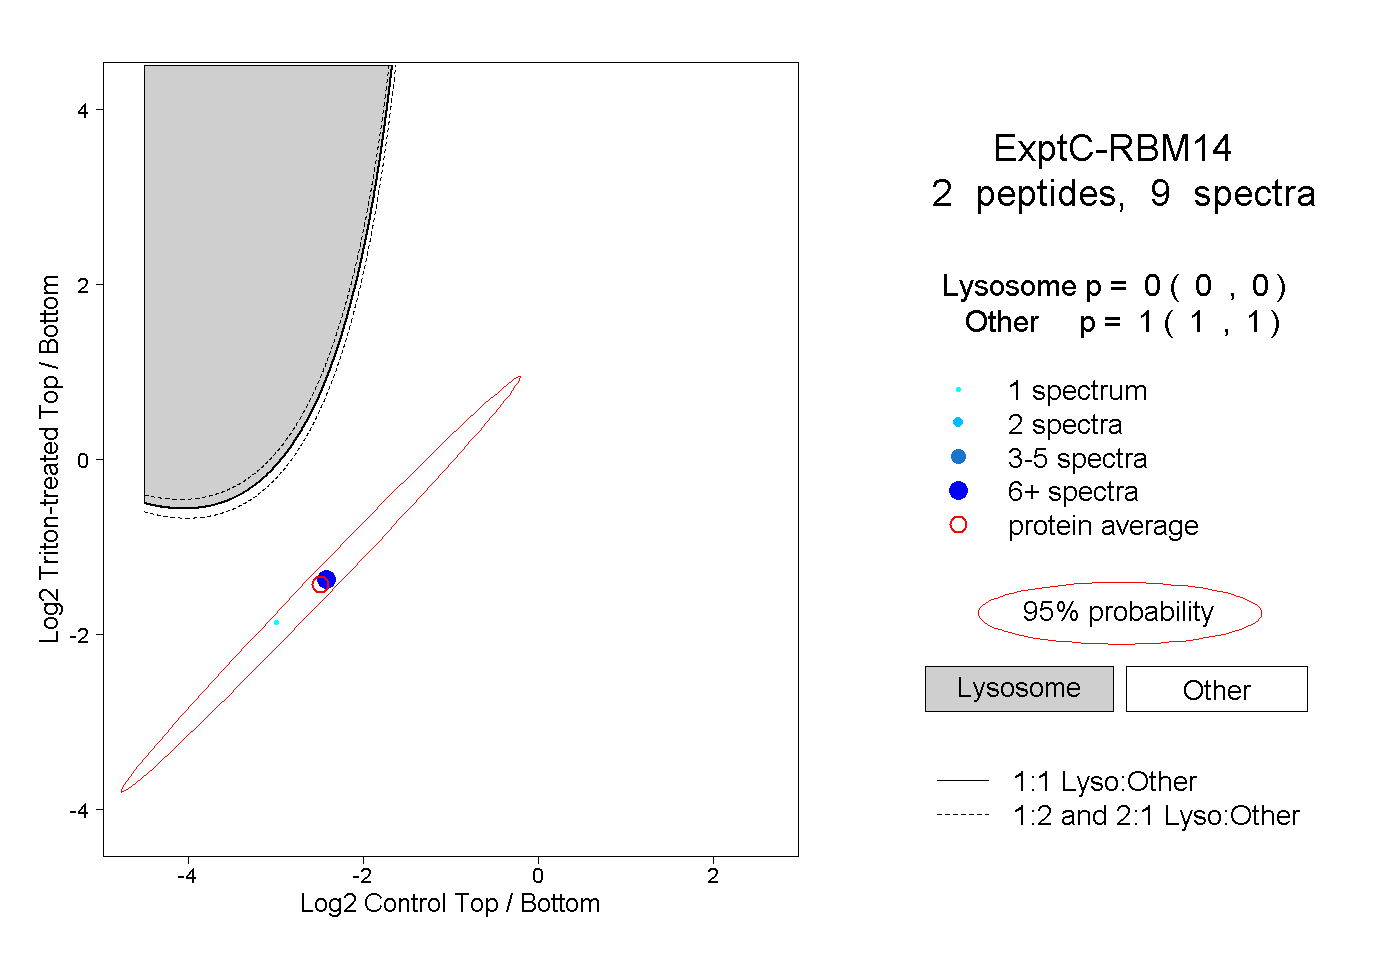
0.000 | 0.000
1.000 | 1.000
1peptide
spectra
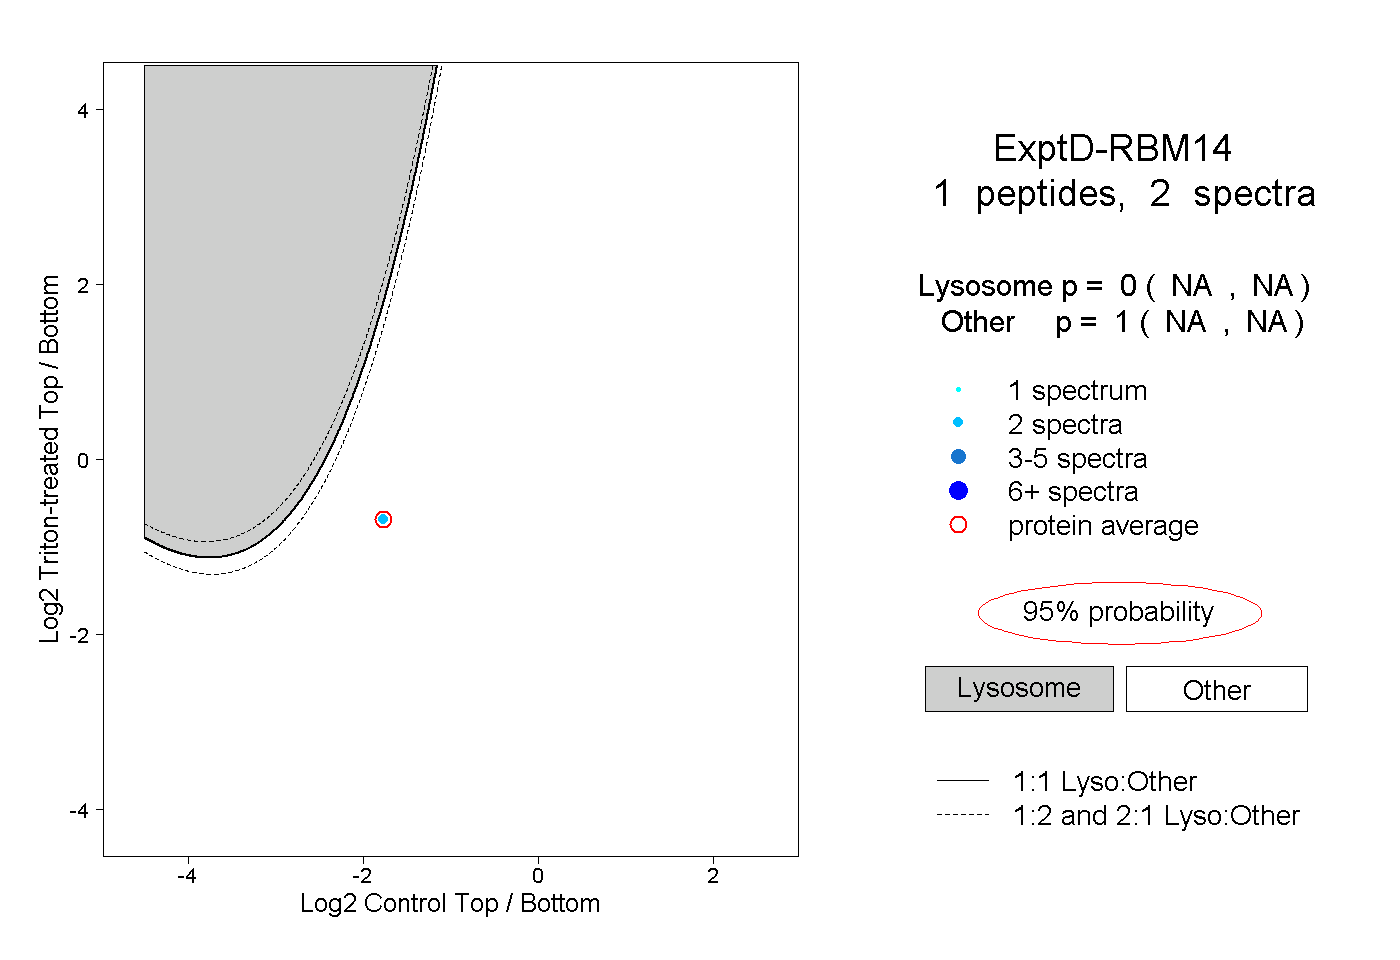
NA | NA
NA | NA