 6
6peptides
spectra
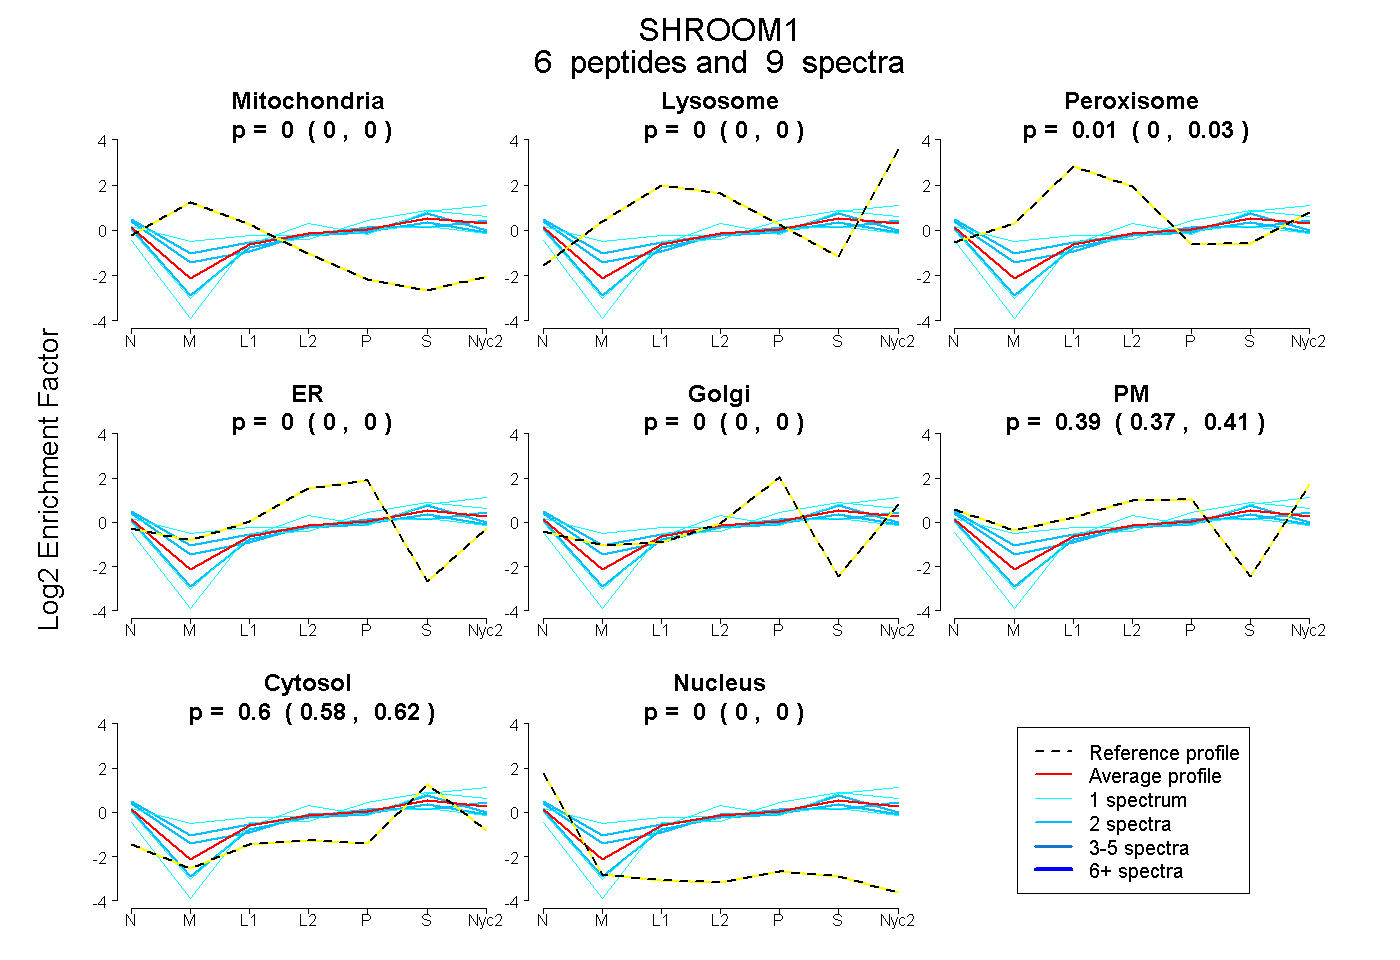
0.000 | 0.000
0.000 | 0.000
0.000 | 0.030
0.000 | 0.000
0.000 | 0.000
0.370 | 0.406
0.578 | 0.620
0.000 | 0.000
1peptide
spectra
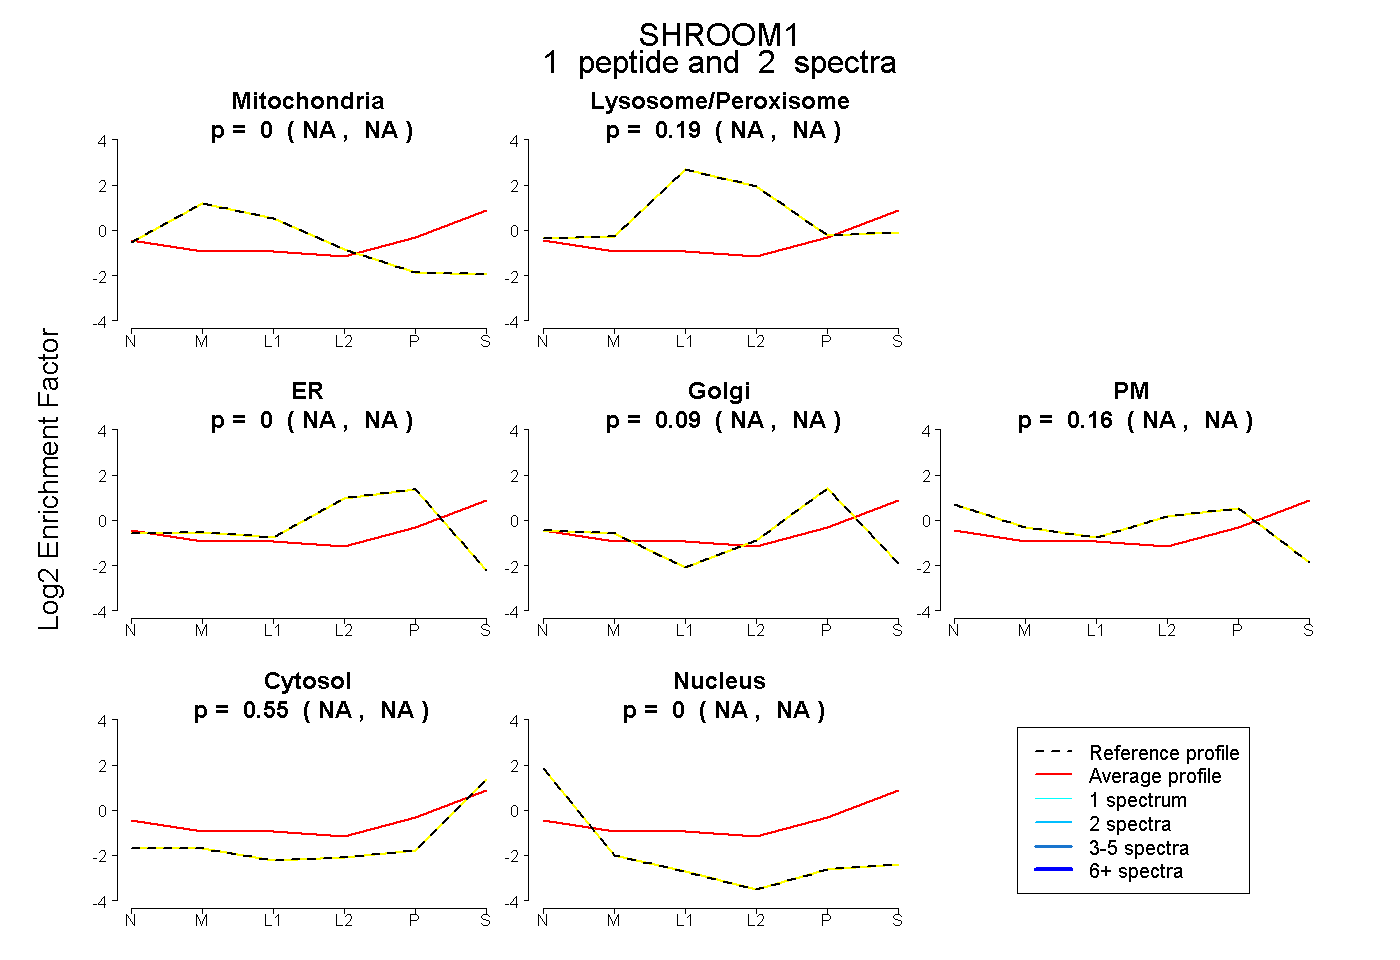
NA | NA
NA | NA
NA | NA
NA | NA
NA | NA
NA | NA
NA | NA
7peptides
spectra
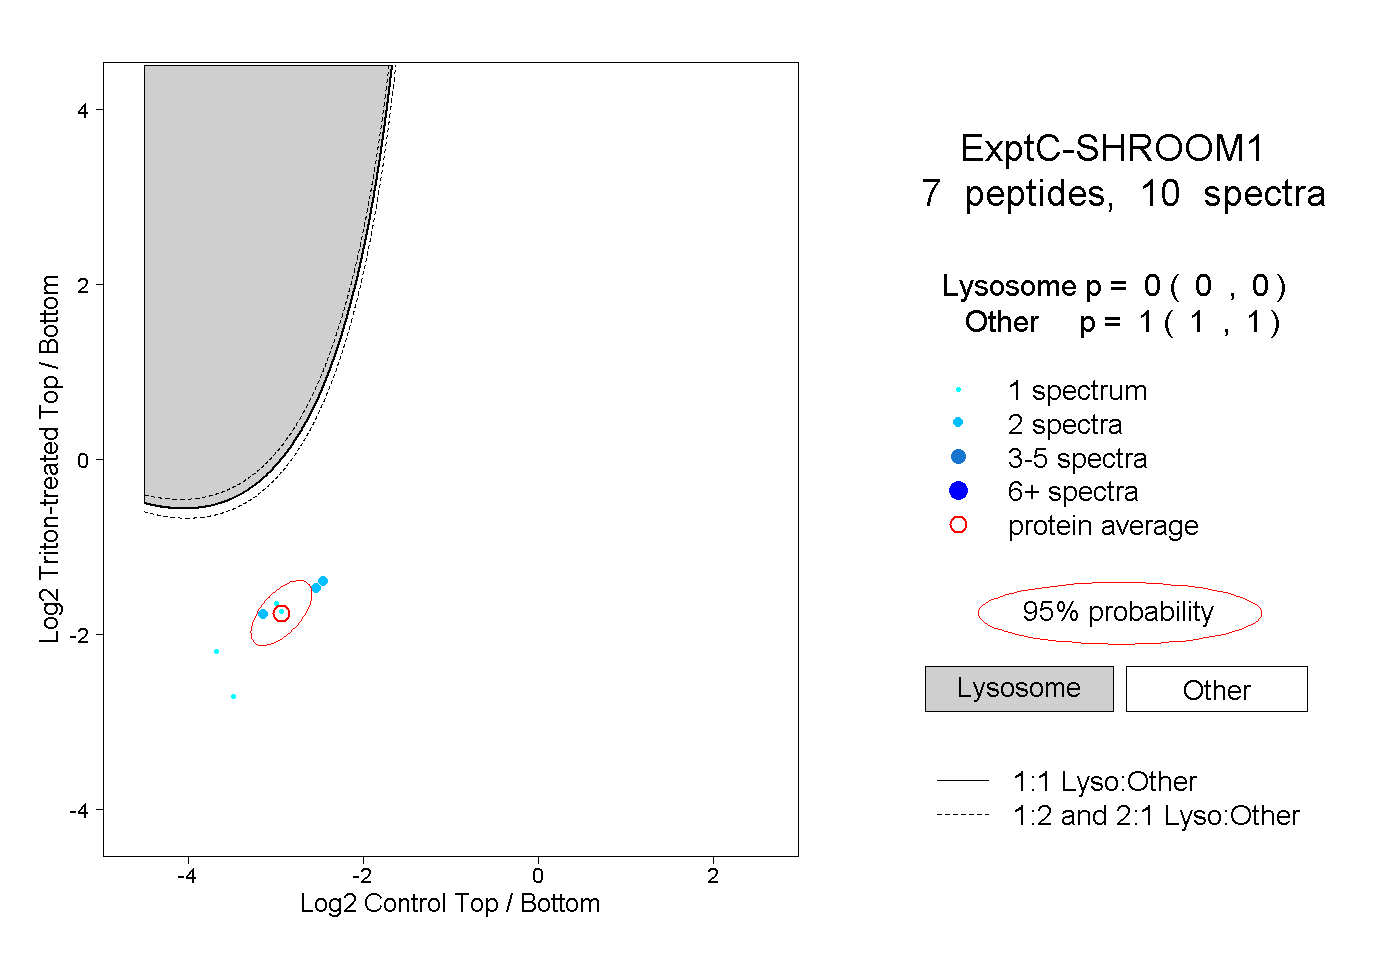
0.000 | 0.000
1.000 | 1.000