 6
6peptides
spectra
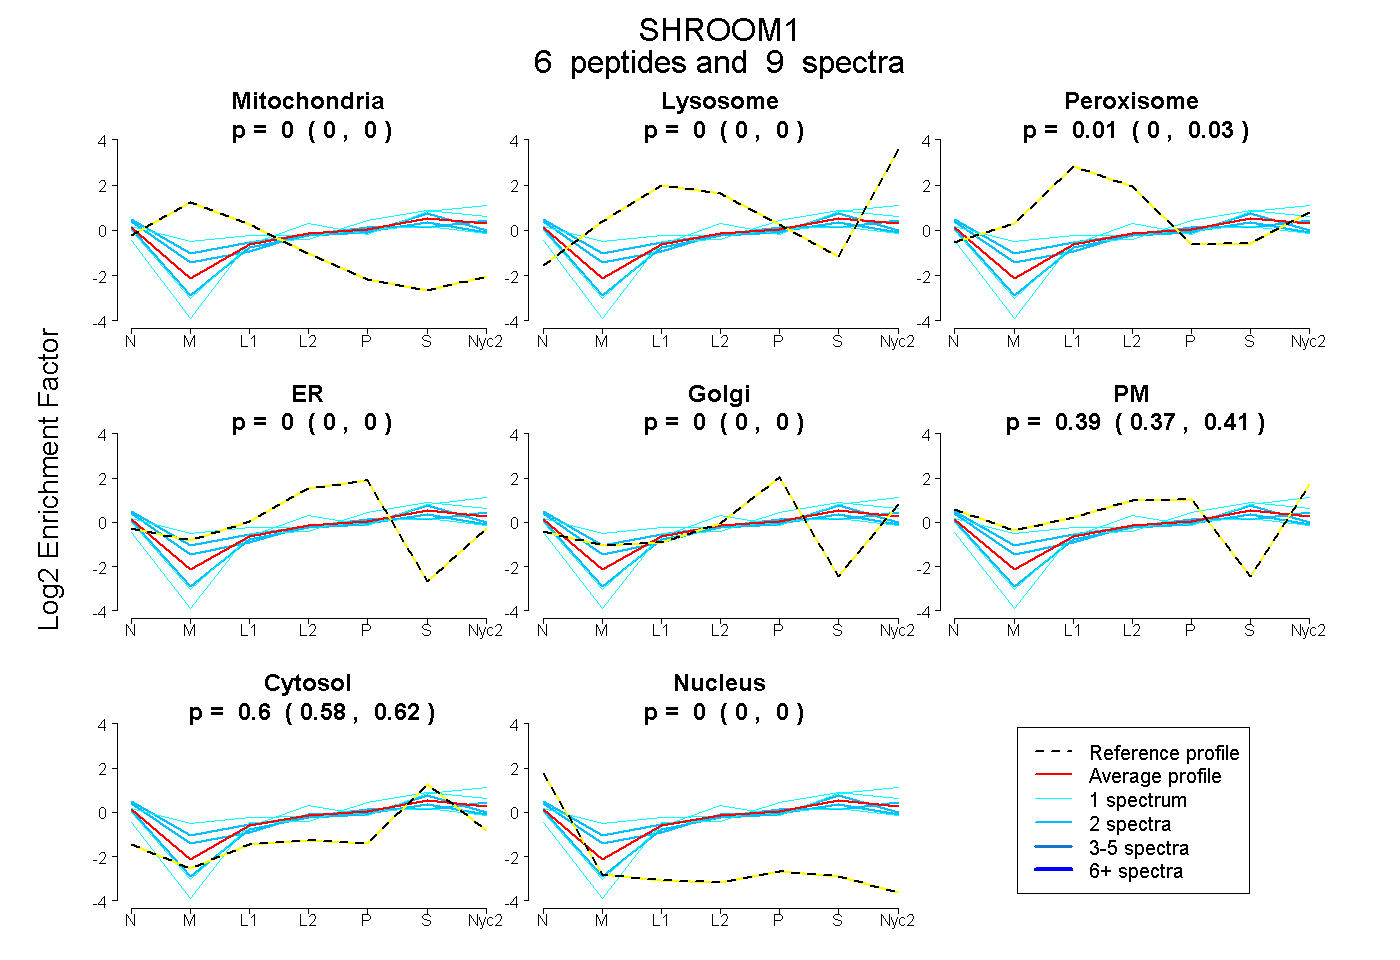
0.000 | 0.000
0.000 | 0.000
0.000 | 0.030
0.000 | 0.000
0.000 | 0.000
0.370 | 0.406
0.578 | 0.620
0.000 | 0.000
| Plot | Mito | Lyso | Perox | ER | Golgi | PM | Cytosol | Nucleus | |||||
| Expt A |
6 peptides |
9 spectra |
|
0.000 0.000 | 0.000 |
0.000 0.000 | 0.000 |
0.006 0.000 | 0.030 |
0.000 0.000 | 0.000 |
0.000 0.000 | 0.000 |
0.393 0.370 | 0.406 |
0.601 0.578 | 0.620 |
0.000 0.000 | 0.000 |
| 2 spectra, TPSPGTER | 0.000 | 0.000 | 0.000 | 0.003 | 0.000 | 0.299 | 0.698 | 0.000 | ||
| 1 spectrum, LSWAPGIRPLDK | 0.078 | 0.000 | 0.145 | 0.000 | 0.007 | 0.328 | 0.441 | 0.000 | ||
| 1 spectrum, TSQASDTESLDLR | 0.000 | 0.085 | 0.000 | 0.000 | 0.000 | 0.295 | 0.619 | 0.000 | ||
| 2 spectra, ILSQQR | 0.000 | 0.000 | 0.029 | 0.000 | 0.000 | 0.493 | 0.478 | 0.000 | ||
| 2 spectra, HFEELVQELAR | 0.000 | 0.000 | 0.006 | 0.000 | 0.000 | 0.414 | 0.561 | 0.018 | ||
| 1 spectrum, TVATVQVVPQR | 0.000 | 0.042 | 0.000 | 0.000 | 0.178 | 0.095 | 0.685 | 0.000 |
| Plot | Mito | Lyso or Perox | ER | Golgi | PM | Cytosol | Nucleus | ||||||
| Expt B |
1 peptide |
2 spectra |
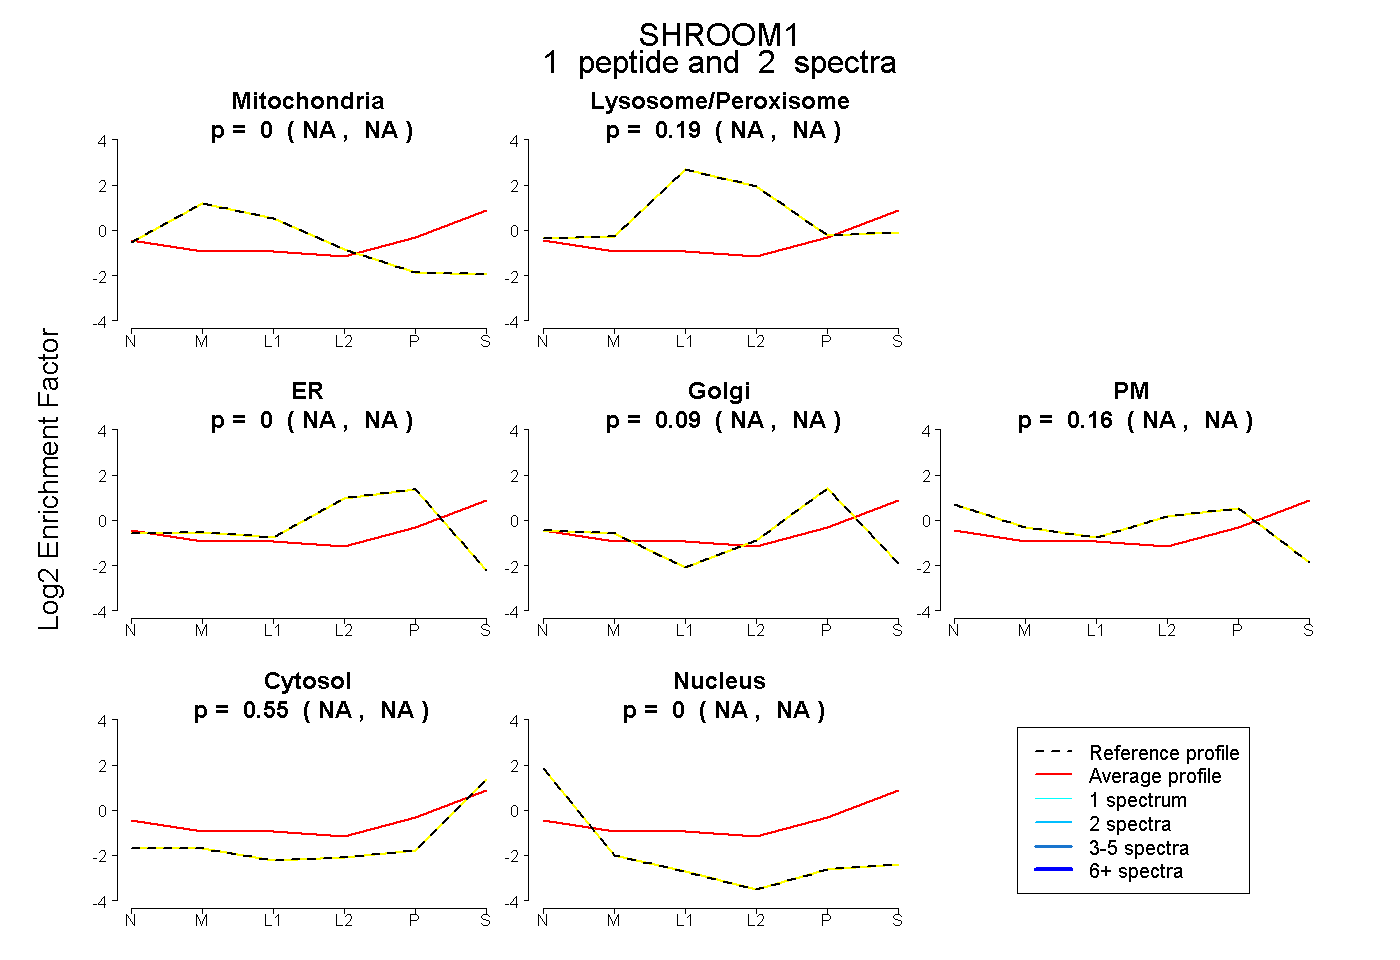 |
0.000 NA | NA |
0.194 NA | NA |
0.000 NA | NA |
0.090 NA | NA |
0.162 NA | NA |
0.555 NA | NA |
0.000 NA | NA |
|||
| Plot | Lyso | Other | |||||||||||
| Expt C |
7 peptides |
10 spectra |
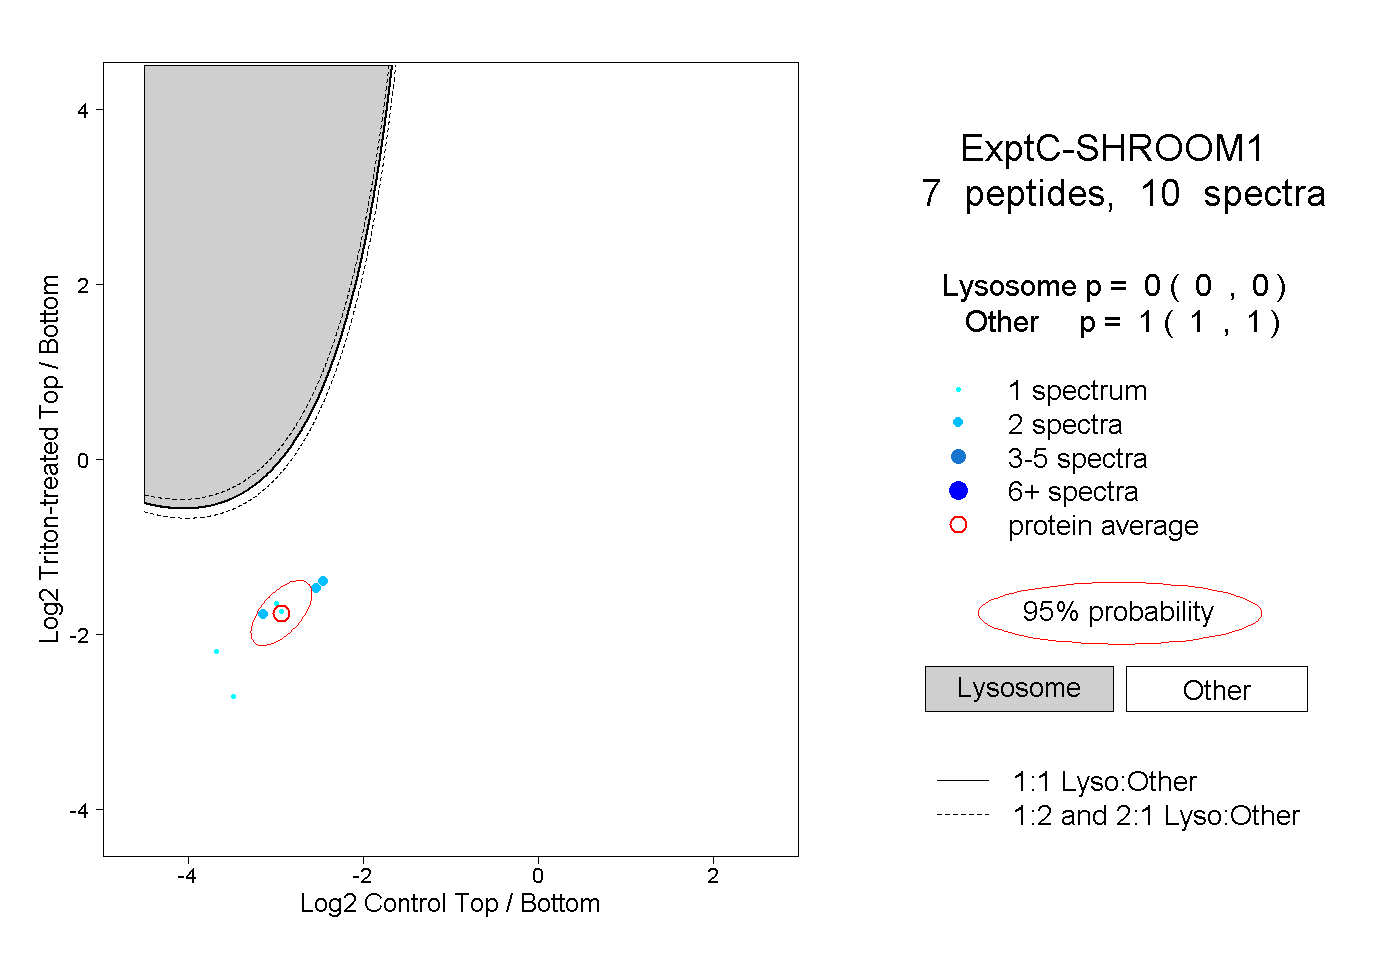 |
0.000 0.000 | 0.000 |
1.000 1.000 | 1.000 |