 13
13peptides
spectra
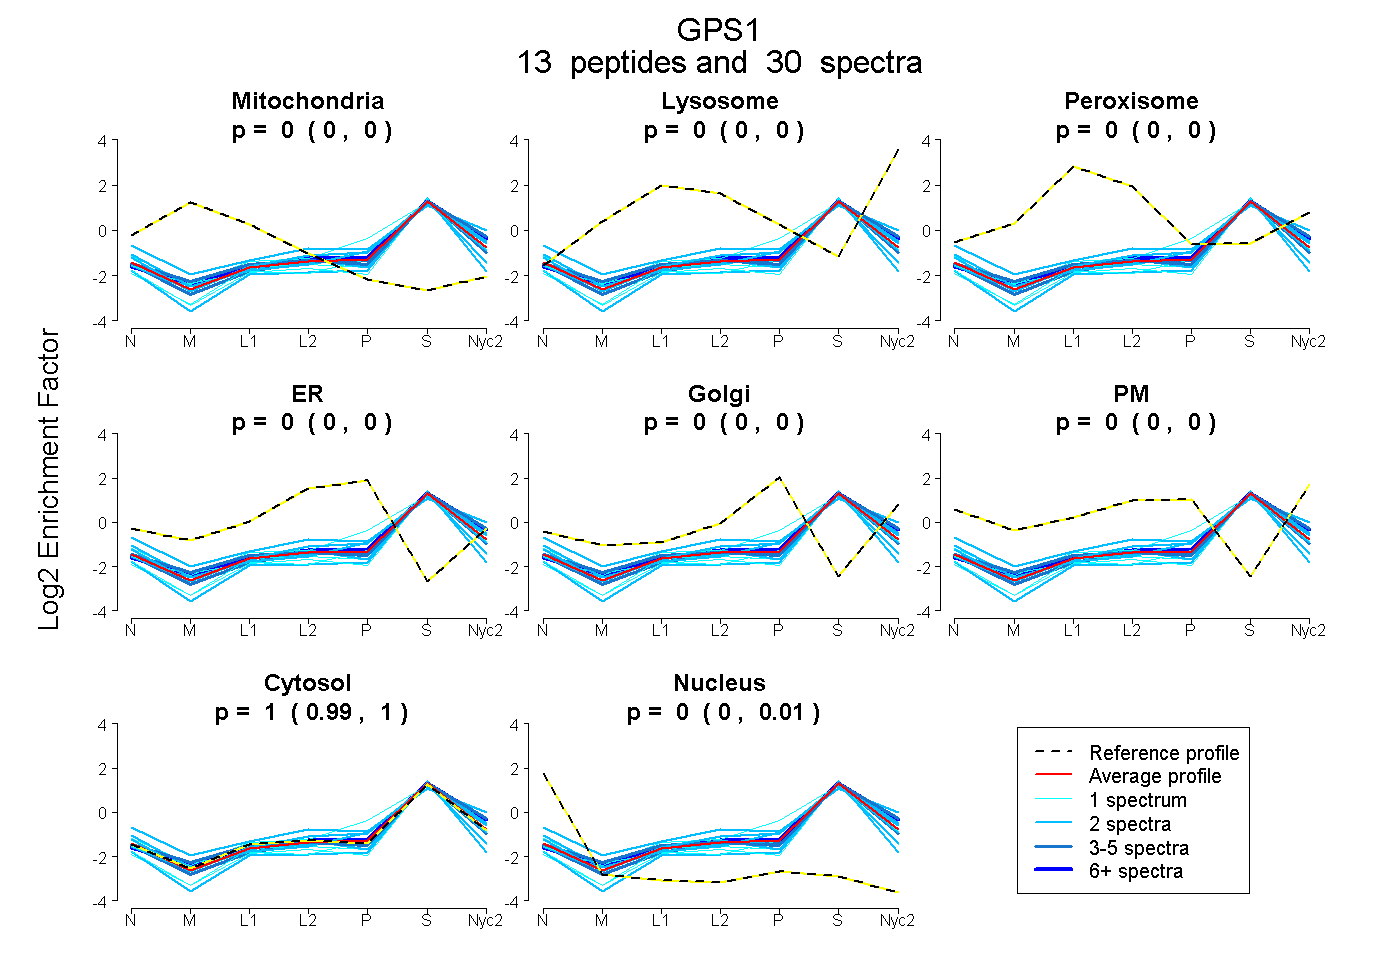
0.000 | 0.000
0.000 | 0.000
0.000 | 0.000
0.000 | 0.000
0.000 | 0.002
0.000 | 0.000
0.993 | 1.000
0.000 | 0.006
6peptides
spectra
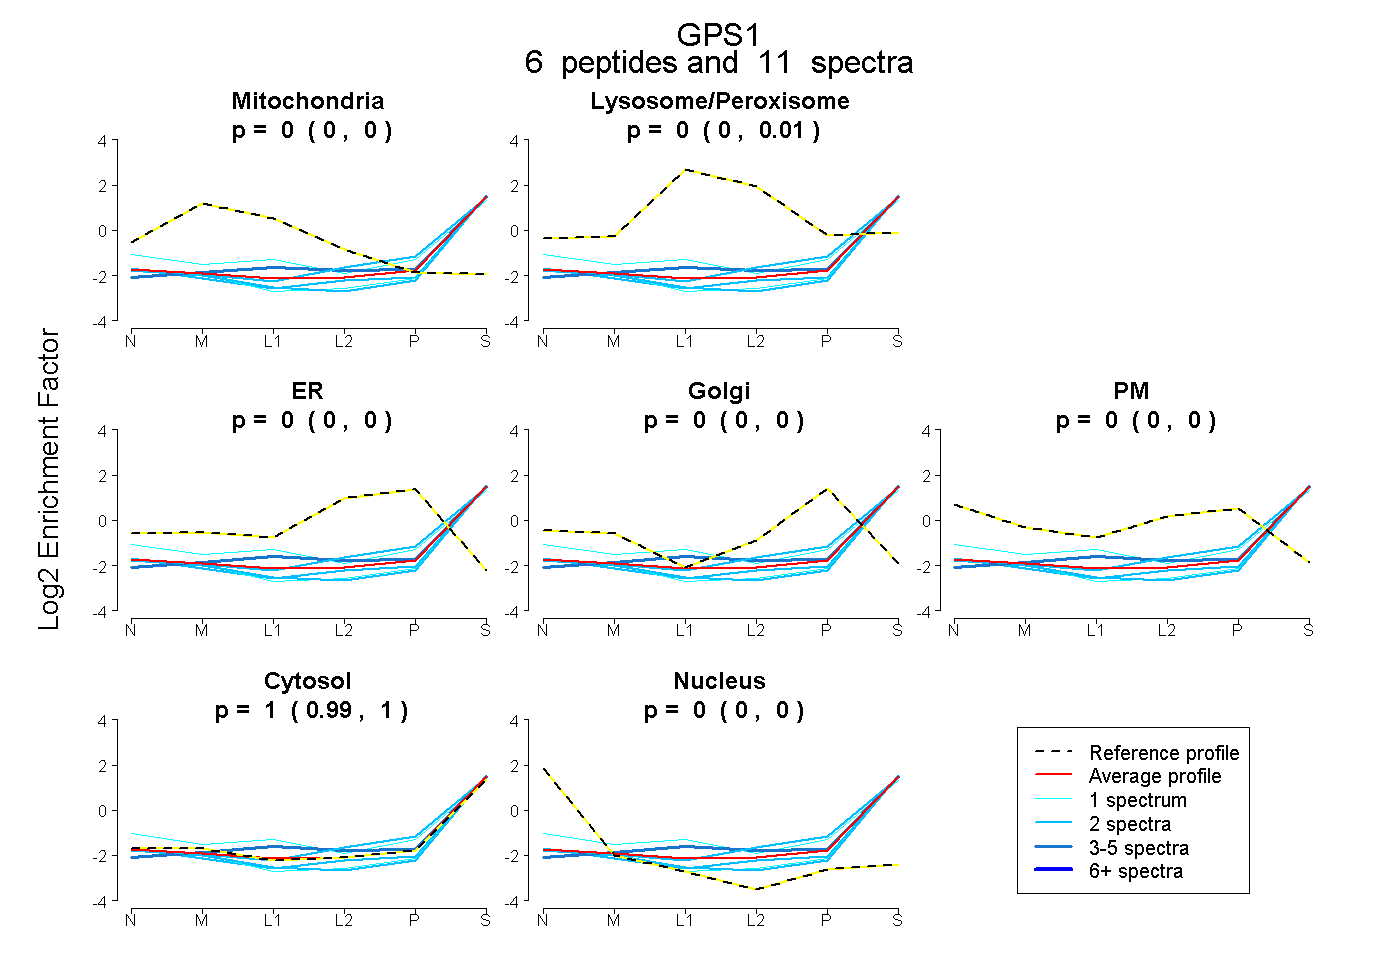
0.000 | 0.000
0.000 | 0.010
0.000 | 0.000
0.000 | 0.000
0.000 | 0.000
0.986 | 1.000
0.000 | 0.000
12peptides
spectra
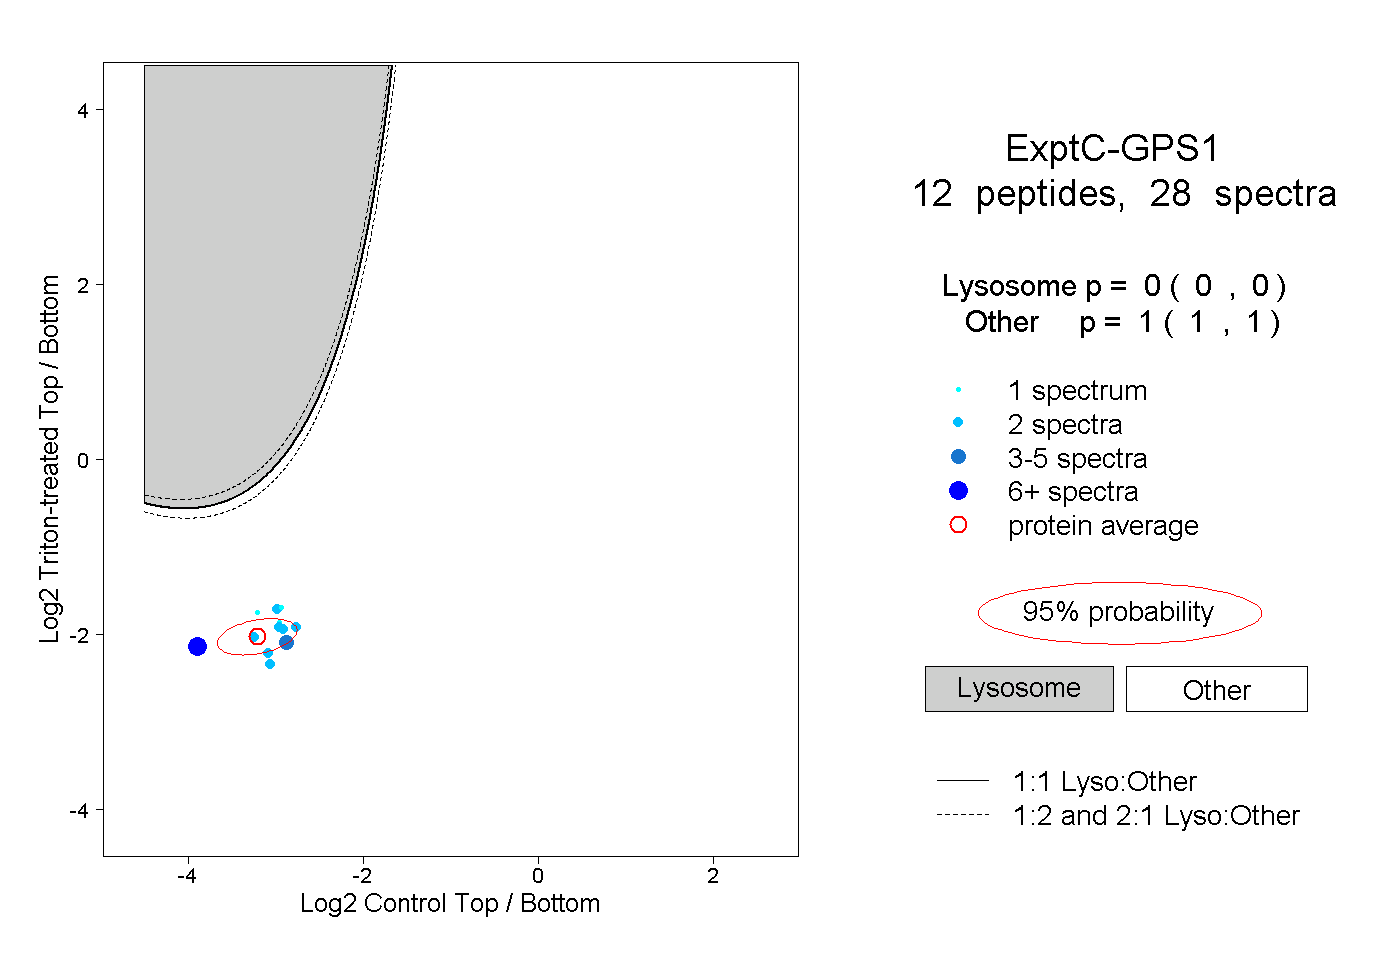
0.000 | 0.000
1.000 | 1.000
2peptides
spectra
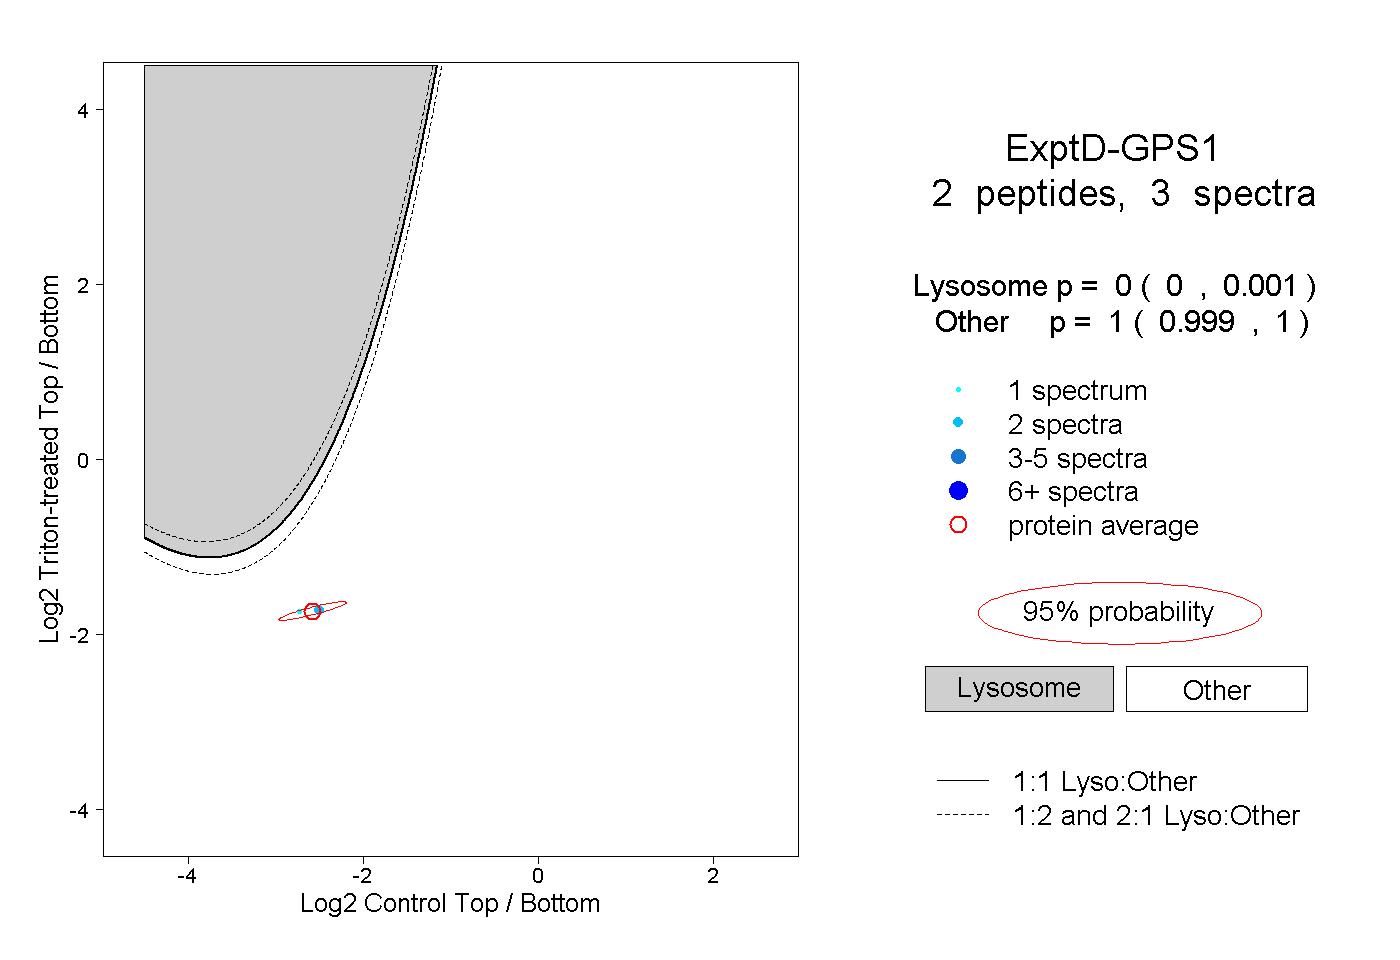
0.000 | 0.001
0.999 | 1.000