 13
13peptides
spectra
0.000 | 0.000
0.000 | 0.000
0.000 | 0.000
0.000 | 0.000
0.000 | 0.002
0.000 | 0.000
0.993 | 1.000
0.000 | 0.006
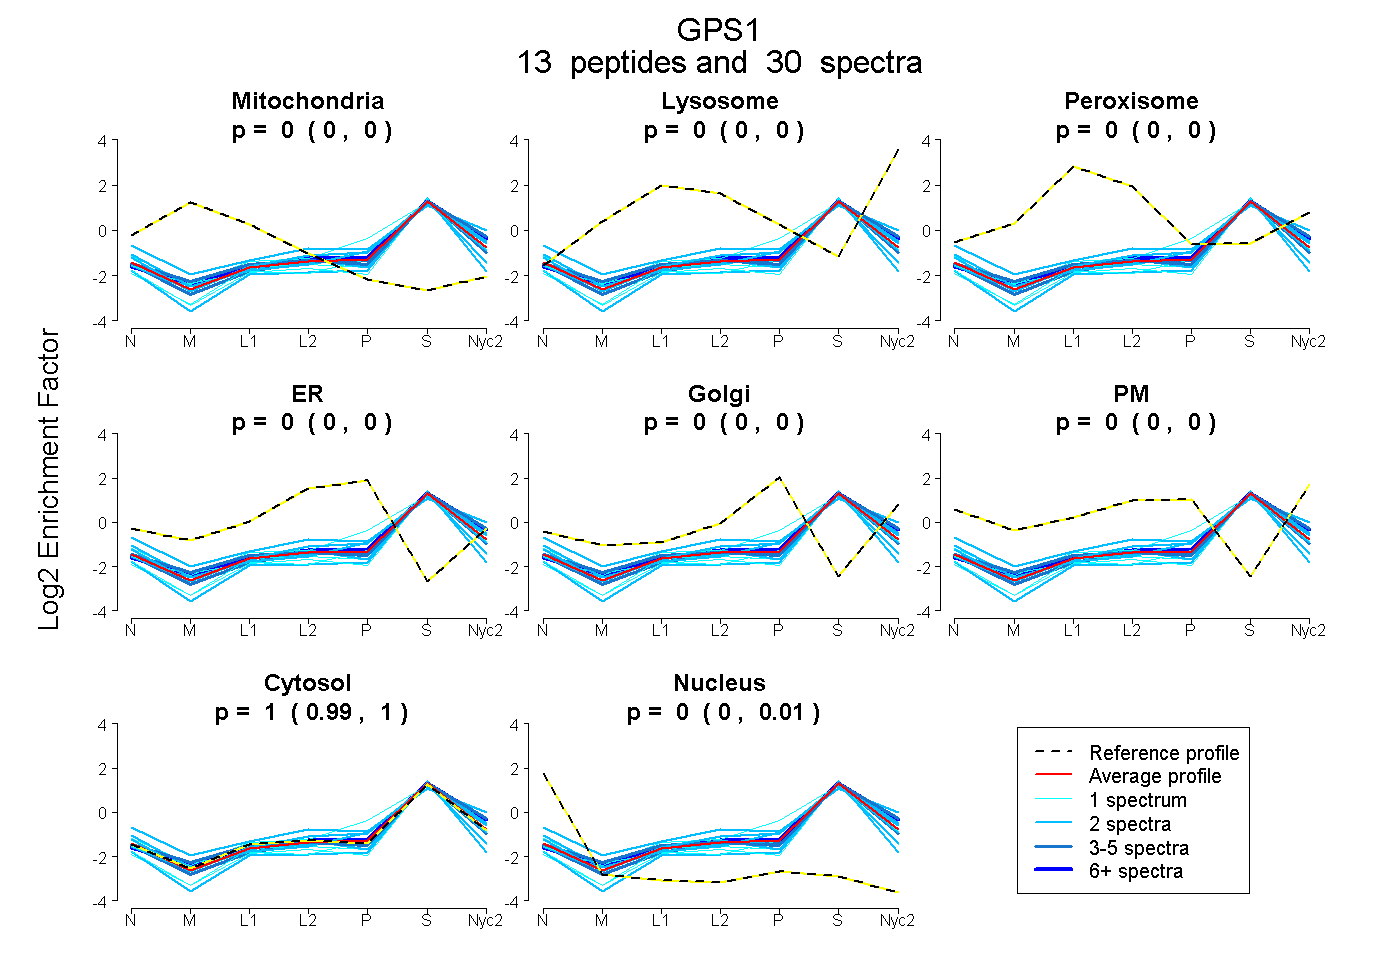
| Plot | Mito | Lyso | Perox | ER | Golgi | PM | Cytosol | Nucleus | |||||
| Expt A |
13 peptides |
30 spectra |
|
0.000 0.000 | 0.000 |
0.000 0.000 | 0.000 |
0.000 0.000 | 0.000 |
0.000 0.000 | 0.000 |
0.000 0.000 | 0.002 |
0.000 0.000 | 0.000 |
0.998 0.993 | 1.000 |
0.002 0.000 | 0.006 |
| 1 spectrum, SLLMGK | 0.000 | 0.000 | 0.000 | 0.000 | 0.121 | 0.000 | 0.879 | 0.000 | ||
| 2 spectra, NVISSSSFK | 0.000 | 0.000 | 0.000 | 0.000 | 0.000 | 0.000 | 1.000 | 0.000 | ||
| 2 spectra, STTFEK | 0.000 | 0.000 | 0.000 | 0.000 | 0.058 | 0.000 | 0.923 | 0.018 | ||
| 2 spectra, EGSQGELTPANSQSR | 0.000 | 0.000 | 0.000 | 0.000 | 0.000 | 0.000 | 0.910 | 0.090 | ||
| 4 spectra, TLYTQIR | 0.000 | 0.045 | 0.000 | 0.000 | 0.000 | 0.000 | 0.955 | 0.000 | ||
| 1 spectrum, DYCTSAK | 0.000 | 0.000 | 0.000 | 0.000 | 0.000 | 0.000 | 0.979 | 0.021 | ||
| 2 spectra, DSQTQAILTK | 0.000 | 0.000 | 0.000 | 0.000 | 0.000 | 0.000 | 0.998 | 0.002 | ||
| 2 spectra, YASCLK | 0.000 | 0.000 | 0.000 | 0.027 | 0.000 | 0.000 | 0.936 | 0.037 | ||
| 3 spectra, AESTPEIAEQR | 0.000 | 0.000 | 0.000 | 0.000 | 0.000 | 0.000 | 0.984 | 0.016 | ||
| 2 spectra, TFNVDMYEEIHR | 0.000 | 0.024 | 0.000 | 0.000 | 0.000 | 0.166 | 0.810 | 0.000 | ||
| 7 spectra, MALSFVQR | 0.000 | 0.044 | 0.000 | 0.000 | 0.000 | 0.000 | 0.956 | 0.000 | ||
| 1 spectrum, MLDEMK | 0.000 | 0.000 | 0.000 | 0.000 | 0.025 | 0.000 | 0.958 | 0.017 | ||
| 1 spectrum, LFLELEPQVR | 0.000 | 0.000 | 0.000 | 0.000 | 0.000 | 0.000 | 0.982 | 0.018 |
| Plot | Mito | Lyso or Perox | ER | Golgi | PM | Cytosol | Nucleus | ||||||
| Expt B |
6 peptides |
11 spectra |
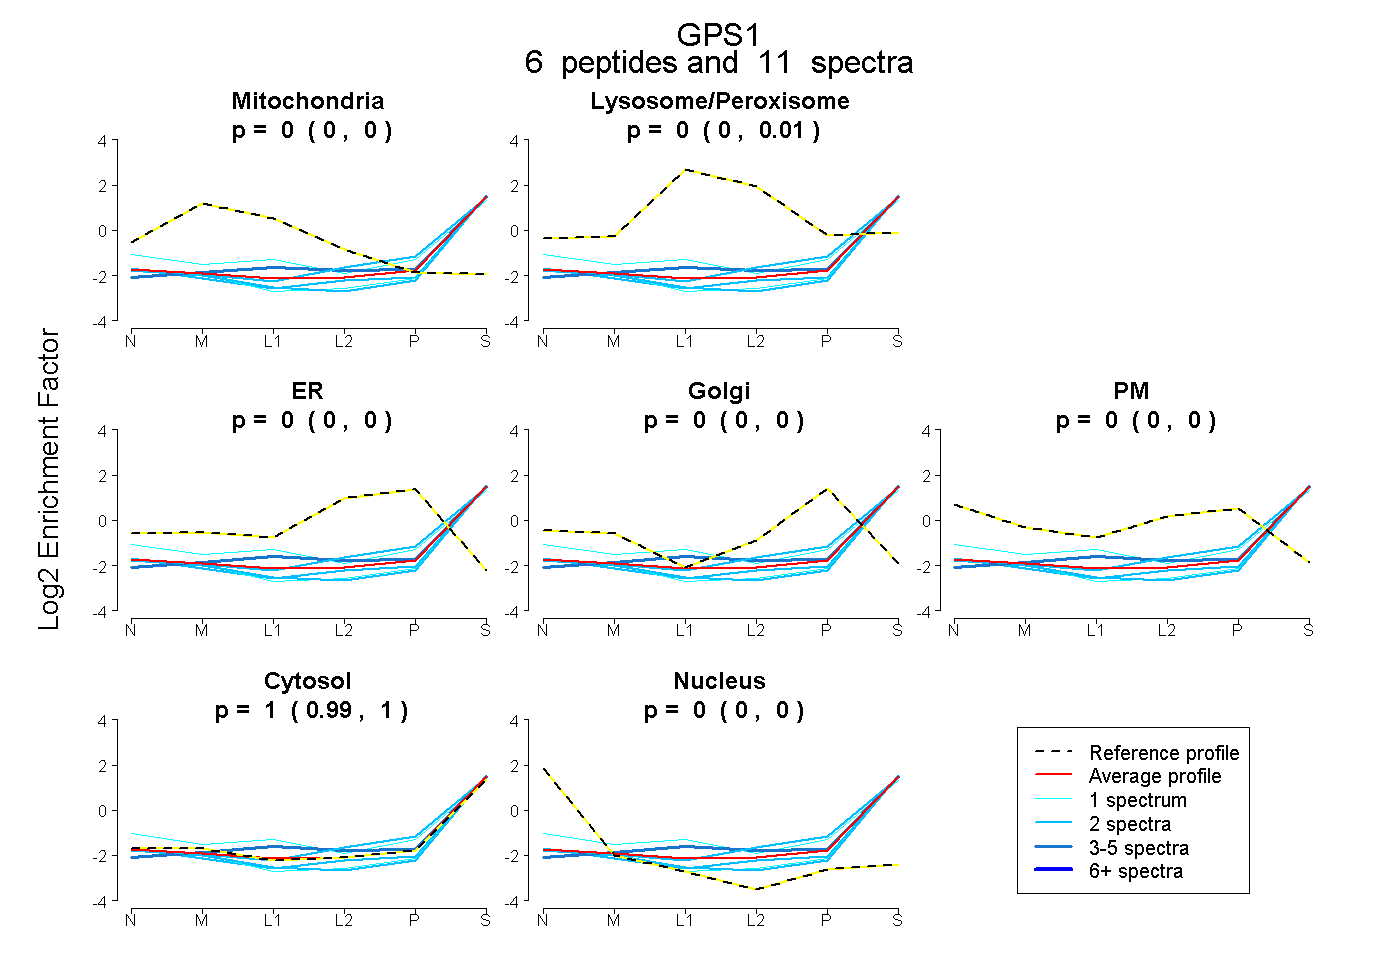 |
0.000 0.000 | 0.000 |
0.000 0.000 | 0.010 |
0.000 0.000 | 0.000 |
0.000 0.000 | 0.000 |
0.000 0.000 | 0.000 |
1.000 0.986 | 1.000 |
0.000 0.000 | 0.000 |
|||
| Plot | Lyso | Other | |||||||||||
| Expt C |
12 peptides |
28 spectra |
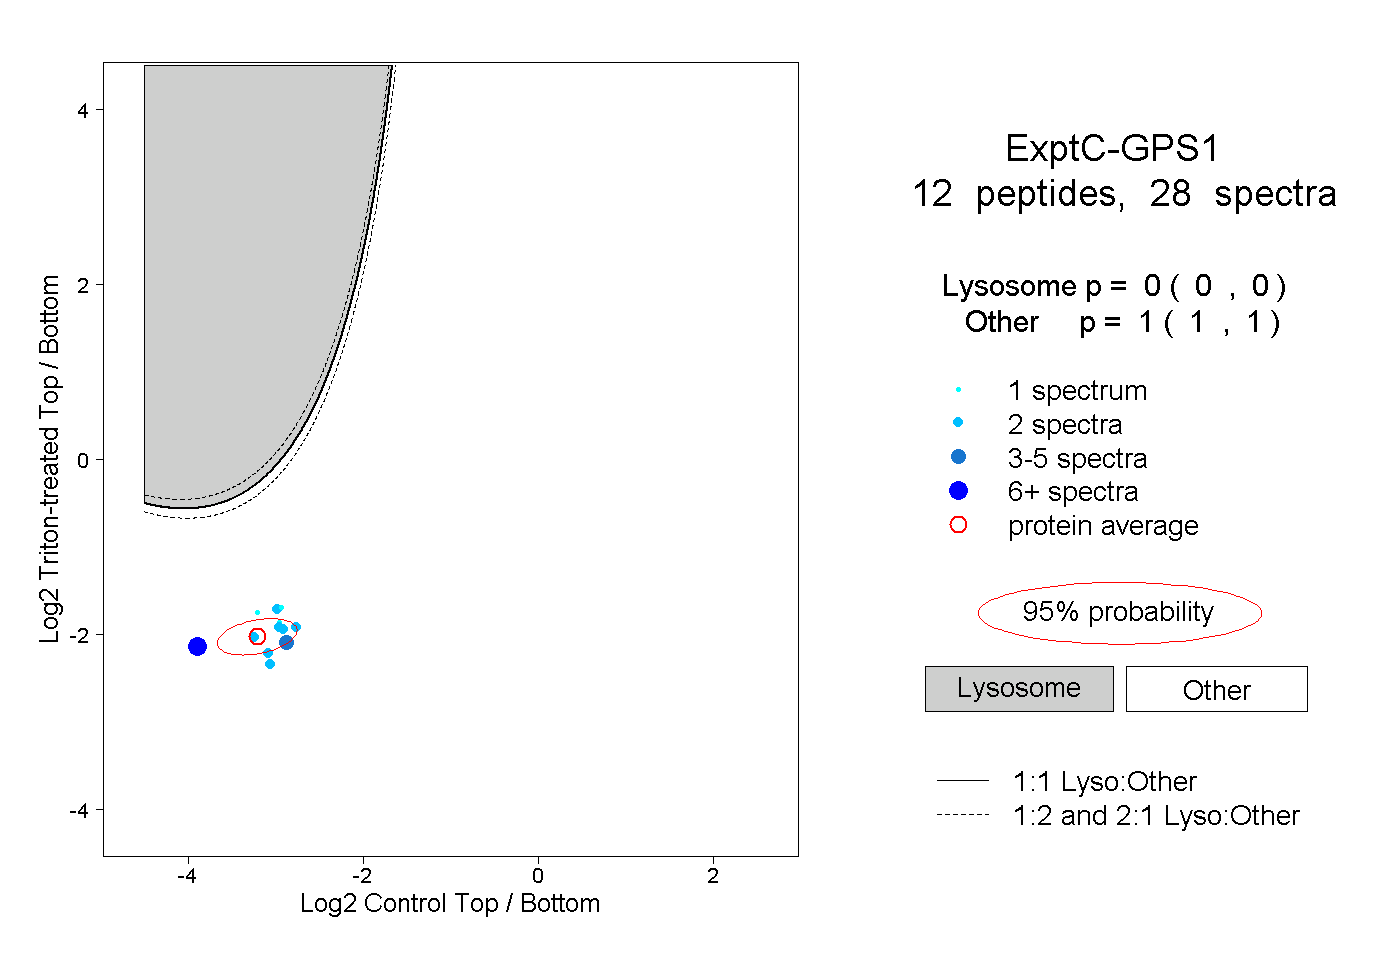 |
0.000 0.000 | 0.000 |
1.000 1.000 | 1.000 |
||||||||
| Plot | Lyso | Other | |||||||||||
| Expt D |
2 peptides |
3 spectra |
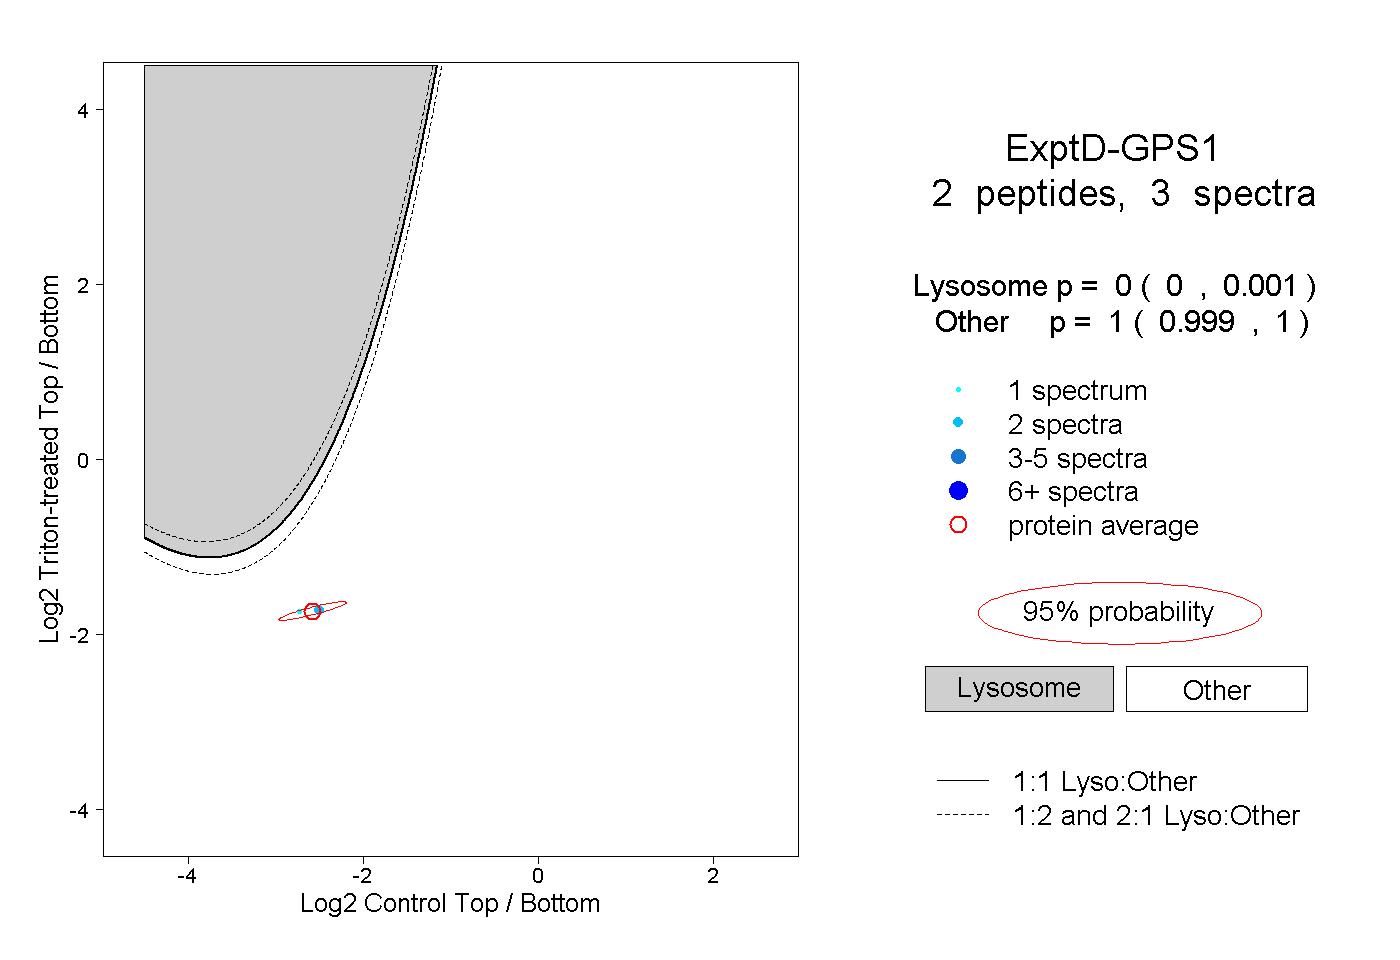 |
0.000 0.000 | 0.001 |
1.000 0.999 | 1.000 |