 7
7peptides
spectra
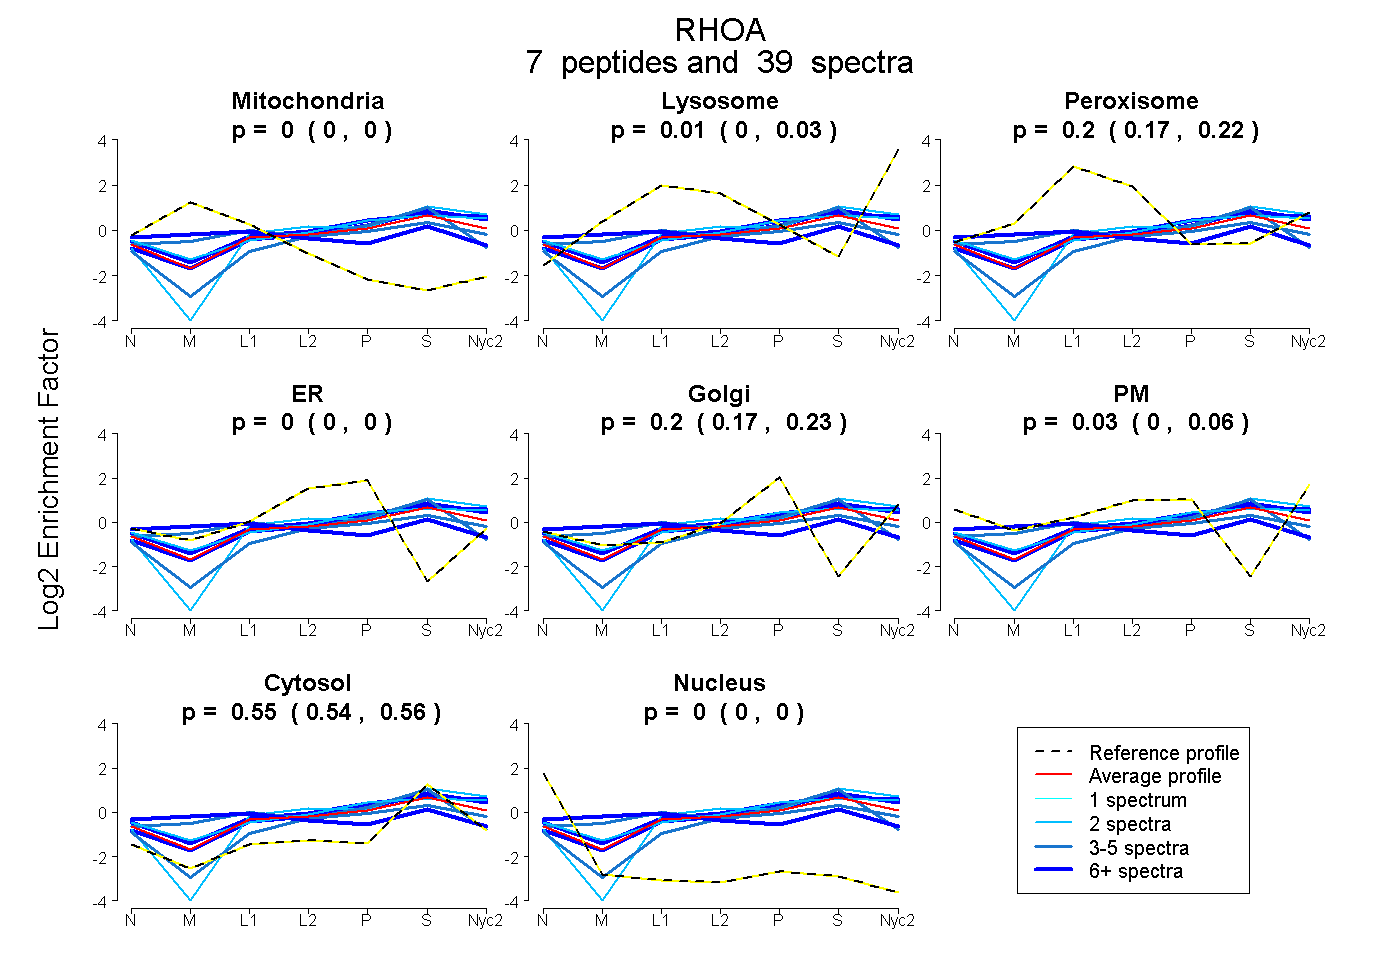
0.000 | 0.000
0.000 | 0.030
0.173 | 0.224
0.000 | 0.000
0.171 | 0.225
0.000 | 0.057
0.540 | 0.565
0.000 | 0.000
5peptides
spectra
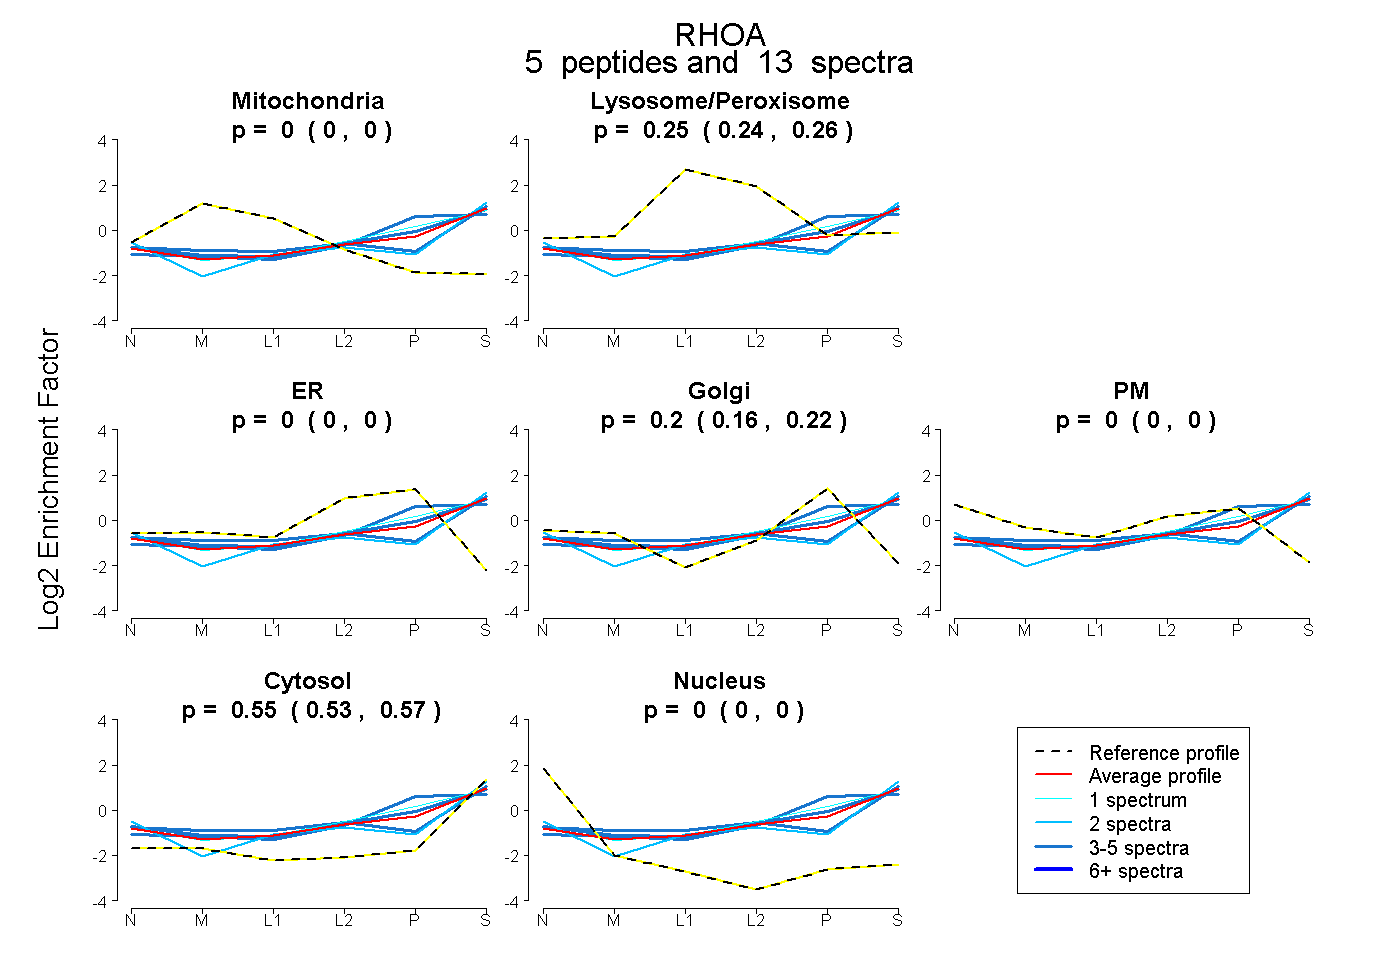
0.000 | 0.000
0.245 | 0.262
0.000 | 0.000
0.158 | 0.218
0.000 | 0.000
0.526 | 0.570
0.000 | 0.000
7peptides
spectra
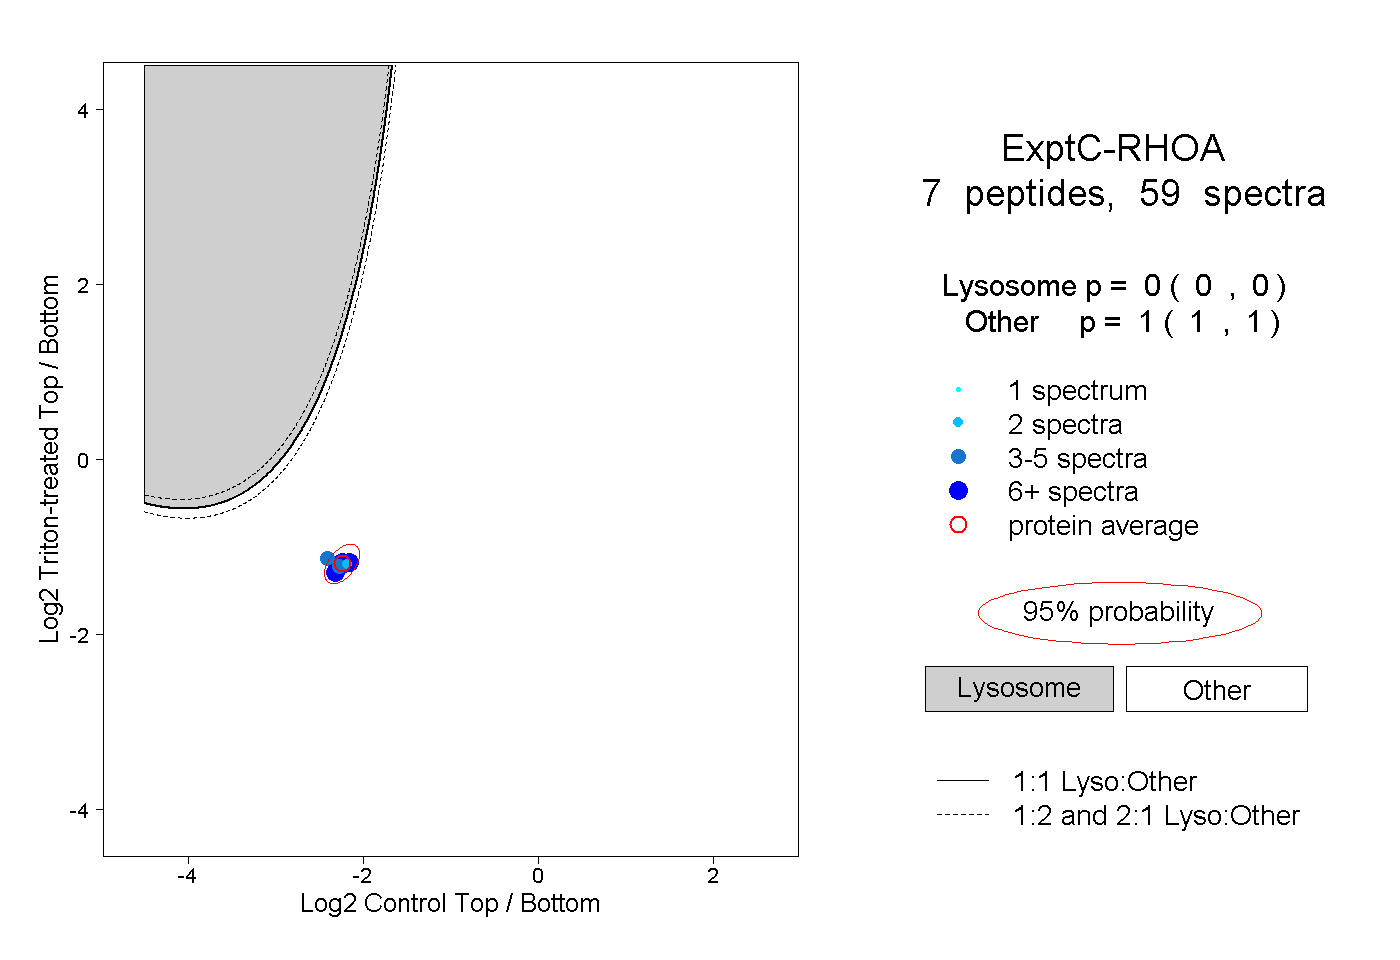
0.000 | 0.000
1.000 | 1.000
1peptide
spectrum
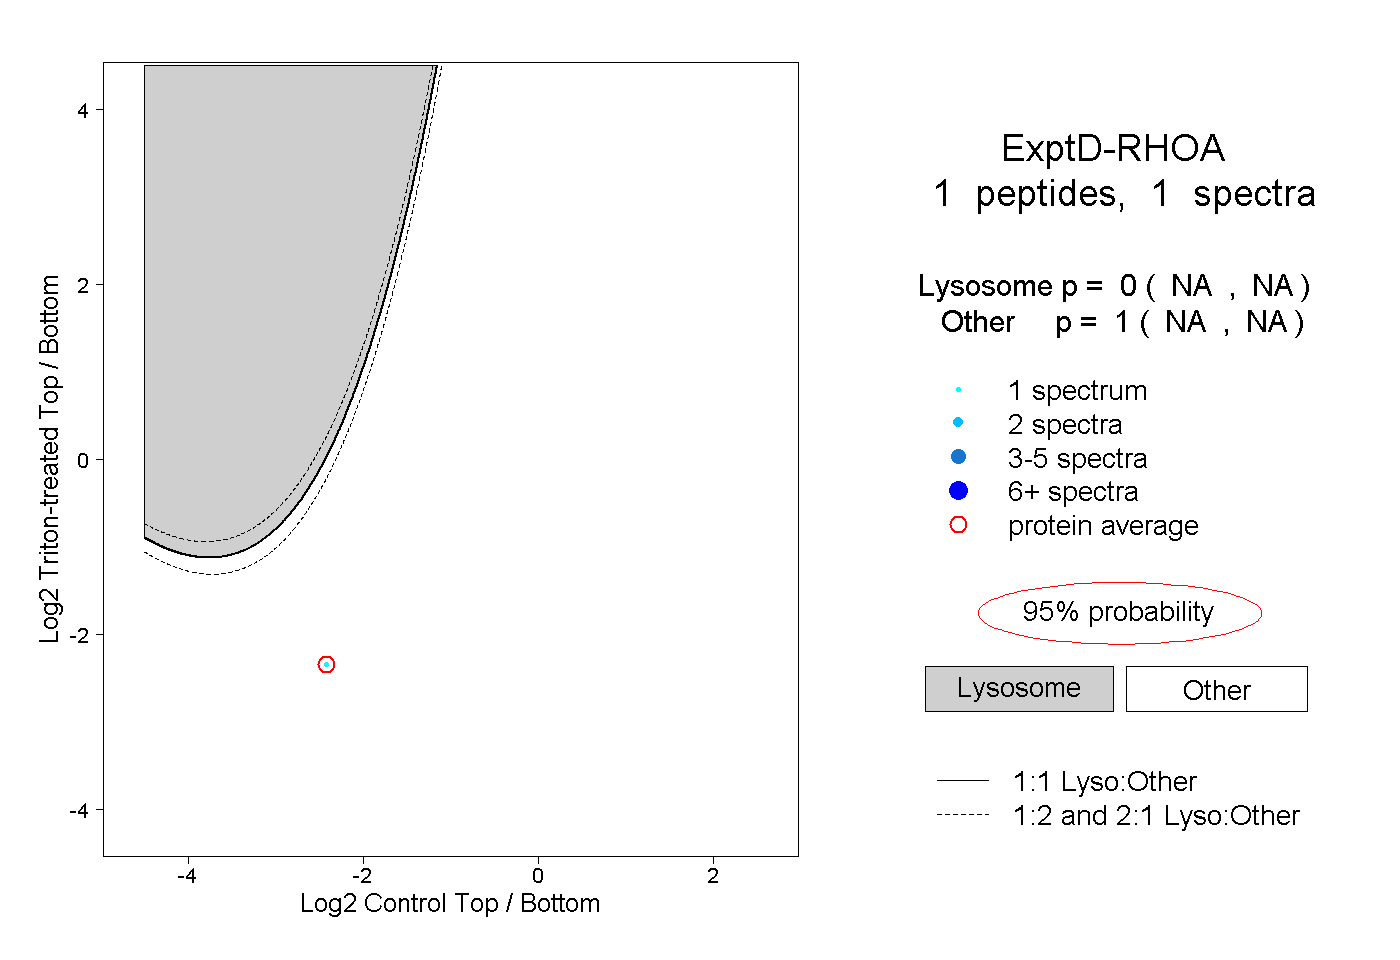
NA | NA
NA | NA