 7
7peptides
spectra
0.000 | 0.000
0.000 | 0.030
0.173 | 0.224
0.000 | 0.000
0.171 | 0.225
0.000 | 0.057
0.540 | 0.565
0.000 | 0.000
| Plot | Mito | Lyso | Perox | ER | Golgi | PM | Cytosol | Nucleus | |||||
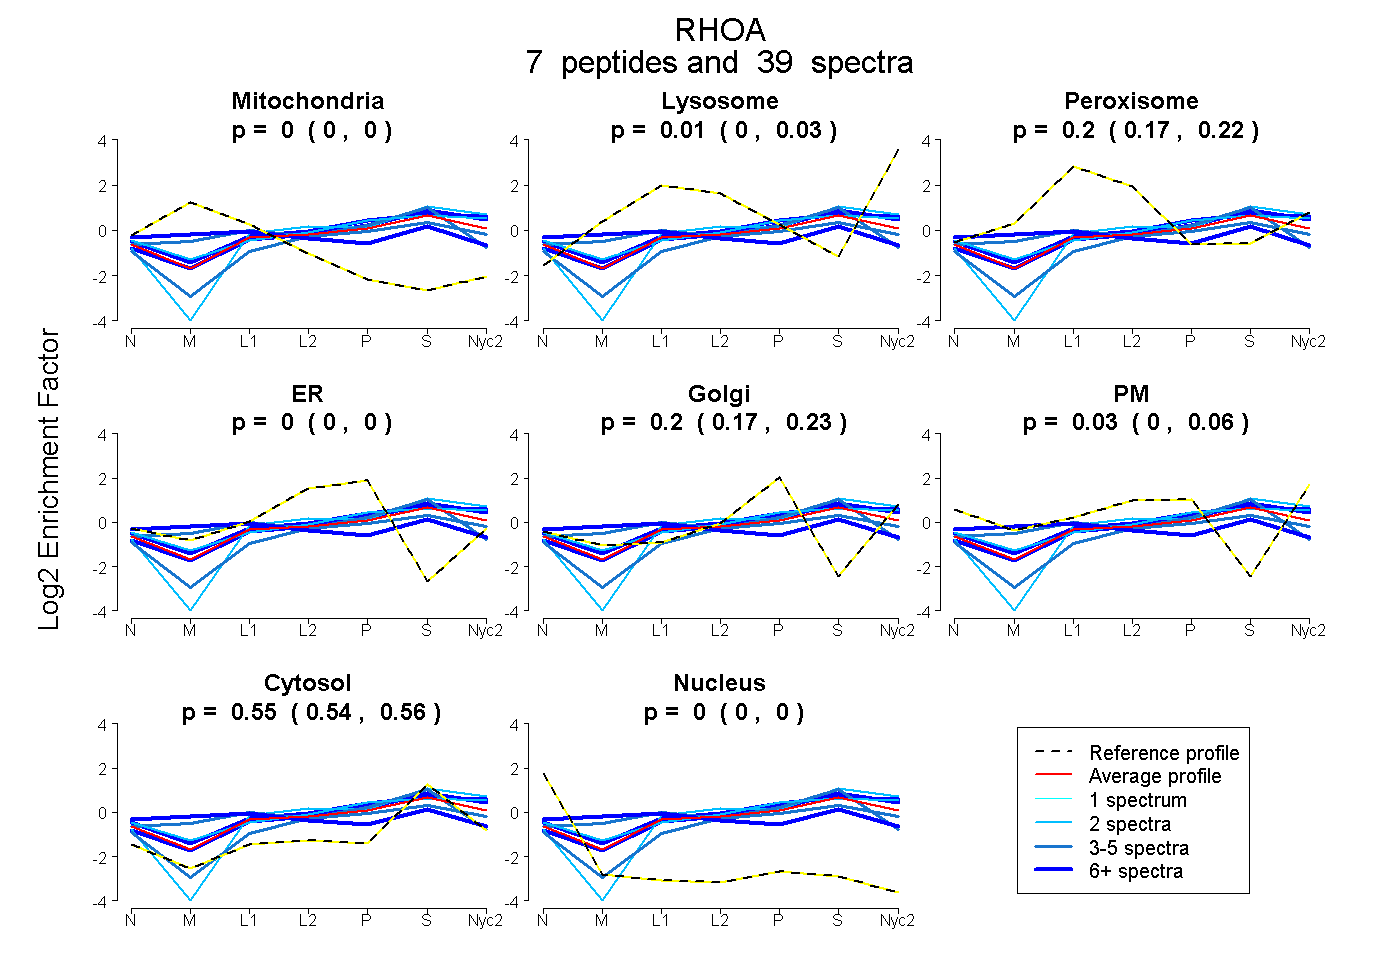
| Expt A |
7 peptides |
39 spectra |
|
0.000 0.000 | 0.000 |
0.012 0.000 | 0.030 |
0.204 0.173 | 0.224 |
0.000 0.000 | 0.000 |
0.202 0.171 | 0.225 |
0.029 0.000 | 0.057 |
0.554 0.540 | 0.565 |
0.000 0.000 | 0.000 |
| 2 spectra, HFCPNVPIILVGNK | 0.000 | 0.181 | 0.000 | 0.106 | 0.000 | 0.001 | 0.712 | 0.000 | ||
| 6 spectra, TCLLIVFSK | 0.219 | 0.000 | 0.252 | 0.000 | 0.088 | 0.026 | 0.414 | 0.000 | ||
| 2 spectra, WTPEVK | 0.000 | 0.113 | 0.079 | 0.000 | 0.157 | 0.142 | 0.509 | 0.000 | ||
| 4 spectra, LVIVGDGACGK | 0.000 | 0.000 | 0.000 | 0.238 | 0.000 | 0.000 | 0.762 | 0.000 | ||
| 10 spectra, AALQAR | 0.000 | 0.132 | 0.094 | 0.000 | 0.139 | 0.127 | 0.508 | 0.000 | ||
| 10 spectra, EVFEMATR | 0.000 | 0.176 | 0.066 | 0.000 | 0.174 | 0.000 | 0.583 | 0.000 | ||
| 5 spectra, IGAFGYMECSAK | 0.057 | 0.000 | 0.311 | 0.000 | 0.200 | 0.000 | 0.431 | 0.000 |
| Plot | Mito | Lyso or Perox | ER | Golgi | PM | Cytosol | Nucleus | ||||||
| Expt B |
5 peptides |
13 spectra |
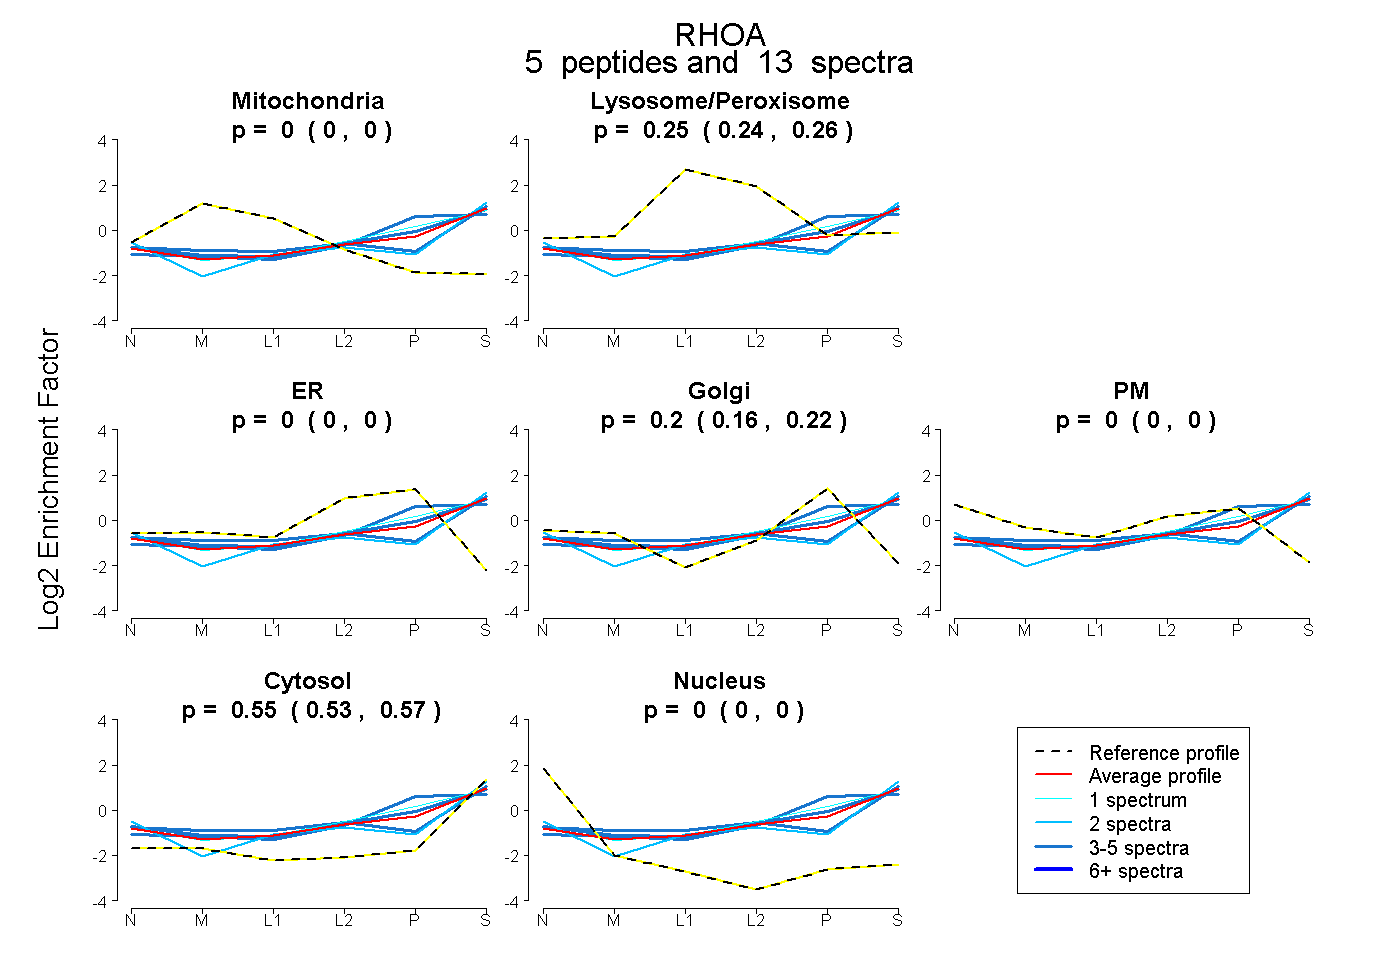 |
0.000 0.000 | 0.000 |
0.255 0.245 | 0.262 |
0.000 0.000 | 0.000 |
0.196 0.158 | 0.218 |
0.000 0.000 | 0.000 |
0.550 0.526 | 0.570 |
0.000 0.000 | 0.000 |
|||
| Plot | Lyso | Other | |||||||||||
| Expt C |
7 peptides |
59 spectra |
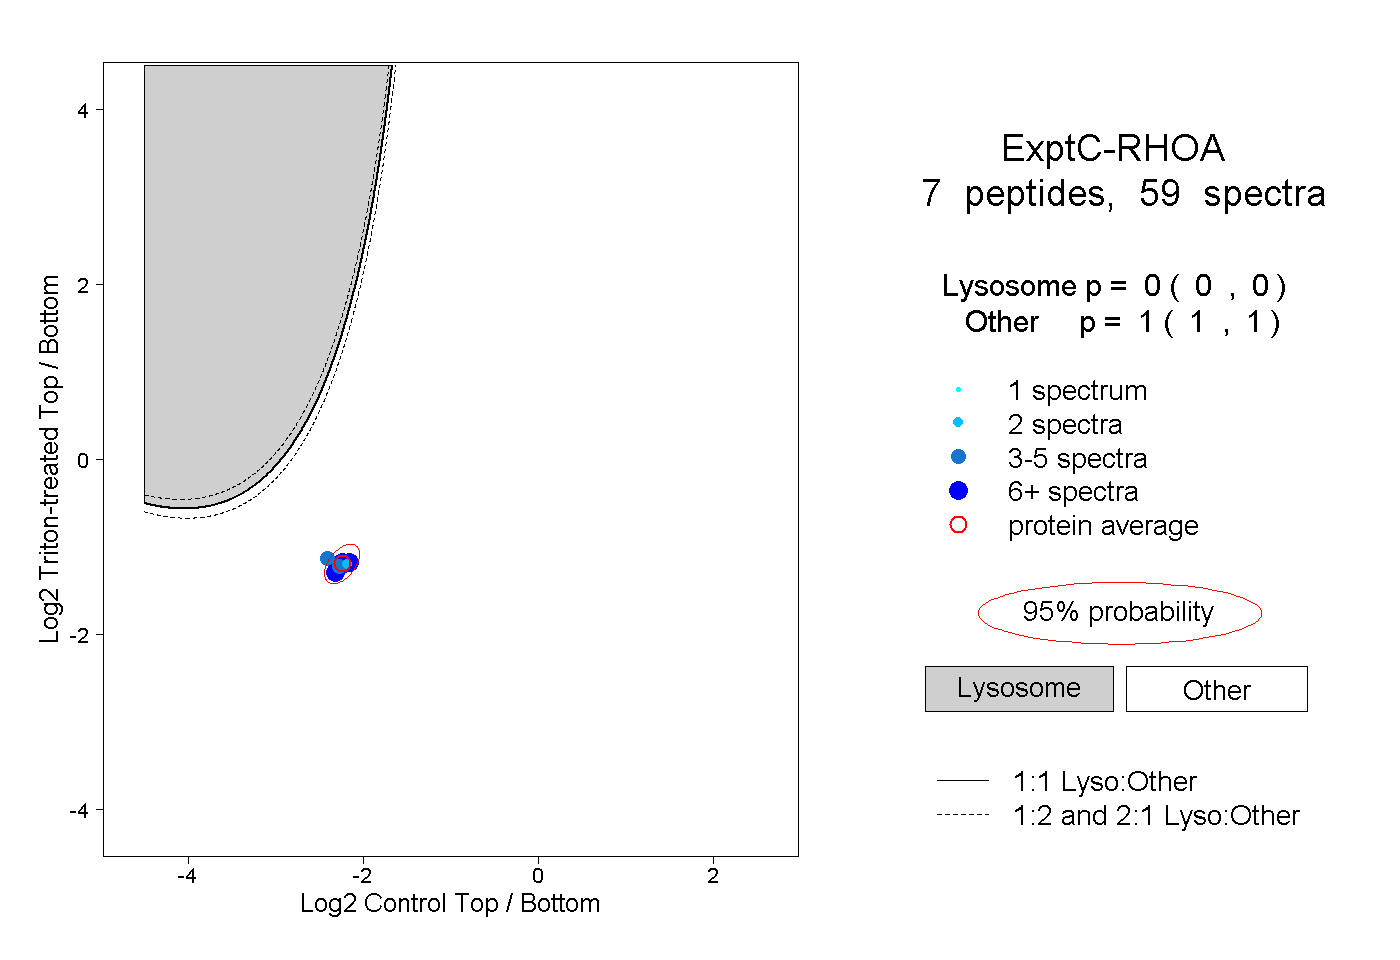 |
0.000 0.000 | 0.000 |
1.000 1.000 | 1.000 |
||||||||
| Plot | Lyso | Other | |||||||||||
| Expt D |
1 peptide |
1 spectrum |
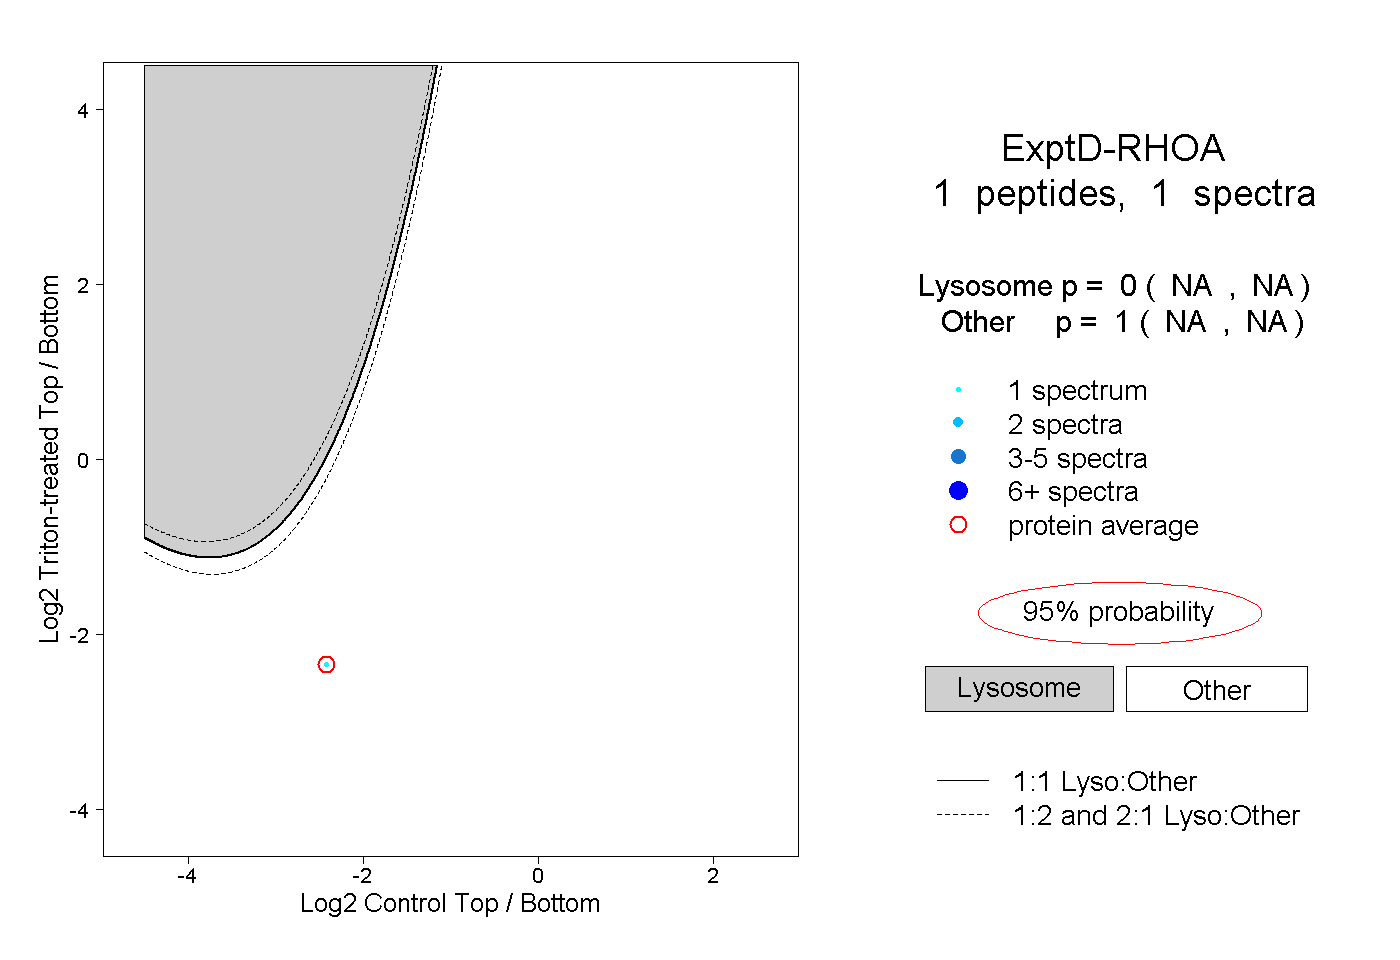 |
0.000 NA | NA |
1.000 NA | NA |